Business intelligence analyst work is exposed wherever the task is digital, repeatable, and specified well enough to generate or transform an output. That includes recurring reports, query drafts, dashboard maintenance, documentation, standard support, and first-pass trend summaries. It does not follow that the occupation, or any individual analyst, has a measurable probability of job loss. The practical move for an early- or mid-career analyst is to map the task bundle, test one low-stakes AI-assisted workflow, and build value around the parts that connect data to a trusted decision: metric definition, semantic modeling, validation, data quality, business context, stakeholder communication, and accountability. Consider an upgrade first when those responsibilities remain within reach. Investigate an adjacent systems, operations research, or management-analysis path when production dominates and the employer offers little room to own redesign. Treat data science or machine-learning engineering as a larger change that requires its own goal and preparation, not as the automatic response to exposure.
The short answer: BI exposure is concentrated in the production layer, not the whole occupation
Imagine opening your calendar on Monday and seeing the same requests you handled last month: refresh the executive dashboard, explain a variance, add a filter, pull a customer segment, check whether a number changed, and turn the result into a short note for a manager. Some of those tasks are now easy for an AI system to assist with. The important question is not whether the system can produce something that resembles the output. It is whether the output uses the right data, the right definition, the right comparison, and the right level of confidence for the decision waiting on it.
The short answer is therefore specific. Business intelligence analyst work is exposed where a task is digital, repeatable, and specified clearly enough that a system can draft, transform, classify, summarize, or retrieve an output. Recurring reports, query drafts, dashboard configuration, routine documentation, standard support, data formatting, and first-pass descriptions of trends sit in that zone. Exposure means that a current capability can assist with or perform part of the task under some conditions. It does not mean that an employer has adopted the capability, that the task is reliable without review, or that the analyst's job will disappear.
The same role also contains work that is harder to reduce to a clean prompt. Someone has to decide what a metric means, whether a source is authoritative, whether two tables can be joined without changing the population, whether a sudden pattern is an error or a real event, and whether the result answers the question the stakeholder actually meant to ask. Someone must explain what is known, what is inferred, and what should not be concluded. Those responsibilities may themselves change as tools improve, but they are not made irrelevant by the ability to generate SQL or prose.
This article uses a five-part chain to keep the claims separate. Capability asks what a tool can do in a controlled setting. Exposure asks which parts of a role are technically applicable to that capability. Use asks whether workers actually use it. Adoption asks whether an employer has placed it inside a governed workflow. Redesign asks whether responsibilities, review steps, staffing, and output expectations have changed. Demand and displacement are later labor outcomes. A source about one link cannot be used as proof of all the others.
The International Labour Organization's 2025 refined exposure index illustrates the distinction. It combines task-level information, expert input, and model predictions, and reports exposure gradients. It does not present a validated probability that a particular worker will be dismissed. Its finding that strongly digitized professional occupations can have increased exposure tells us that a digital role deserves a task-level review. It does not tell us whether the review produces automation, augmentation, higher output expectations, new work, or a different occupation.
Anthropic's Economic Index offers a different window. It studies observed conversations with its system and compares task use across occupational groups. The published analysis says that very few occupations in its dataset saw use across most associated tasks, while moderate use across a meaningful share of tasks was more common. That is evidence about use in one system's data, not a census of BI analyst employers and not a forecast of job losses. It is useful because it directs attention toward uneven task change rather than a binary job label.
O*NET is the occupational anchor for the rest of this article. Its current Business Intelligence Analysts profile defines the occupation around querying data repositories, generating periodic reports, and identifying patterns and trends. The profile also lists maintaining tools and dashboards, managing information flow, supporting users, documenting specifications, testing consistency with defined needs, and synthesizing intelligence for recommendations. In other words, the role is digital throughout, but it is not only production. It joins production, stewardship, interpretation, and a decision interface.
The working assumption is an early- or mid-career, U.S.-oriented knowledge worker whose job includes reporting, dashboards, querying, analysis, and stakeholder requests. That is a reference case, not a claim about every country or employer. A BI analyst in a small company may own data modeling, finance definitions, and executive communication. A specialist in a large company may maintain one dashboard family under strict controls. A consultant may spend more time gathering requirements and presenting recommendations. The title alone cannot tell you which tasks are exposed.
The useful first action is to stop treating exposure as a verdict and write down the task chain behind one recurring deliverable. Who defines the request? Where do the inputs come from? What transformations occur? What can go wrong? Who tests the result? Who explains it? Who is accountable if a decision is made from it? This map will reveal whether your immediate pressure is faster production, more review work, broader scope, or a change in the value your team expects from analysts.
My position is an inference from the occupational structure and the research boundaries, not an individual score. Most BI analysts should first investigate an upgrade that makes trusted decision ownership more visible and technically credible. That recommendation changes when a real employer has already removed the production layer, when the analyst has no authority to improve the workflow, or when the person's desired work is genuinely closer to systems design, optimization, consulting, or engineering. The next sections show how to tell those cases apart.
Sources: O*NET OnLine: Business Intelligence Analysts; ILO: Generative AI and Jobs: A Refined Global Index of Occupational Exposure; Anthropic: Introducing the Anthropic Economic Index
What exactly is a business intelligence analyst being paid to do?
Before deciding what AI exposes, define the work without relying on a title. O*NET gives a more useful starting point than a generic list of tools. Its Business Intelligence Analysts entry describes an occupation that produces financial and market intelligence by querying repositories and generating periodic reports, then devises methods for identifying patterns and trends. The listed tasks show why a single exposure label is too coarse. A report can be generated. The meaning of the report still has to be established.
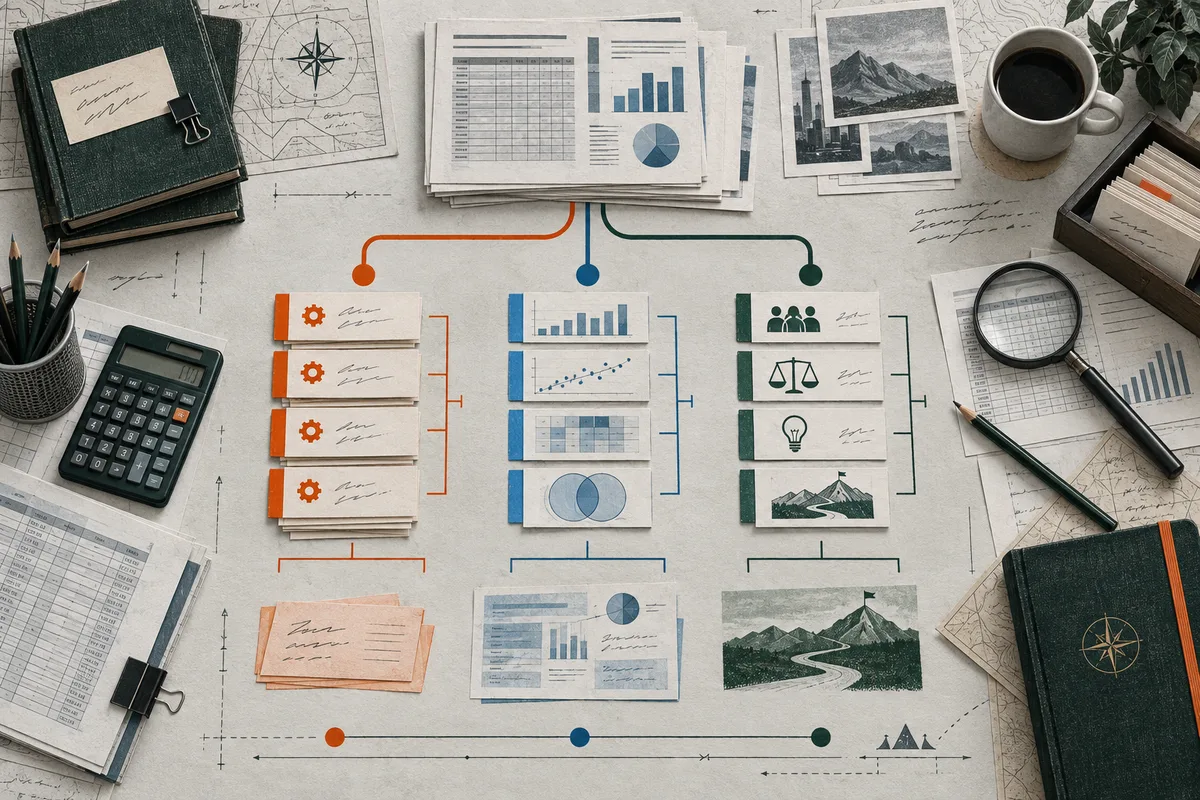
One way to read the task list is as four connected groups. The first is production: generating standard or custom reports, updating dashboards, maintaining business intelligence tools, creating spreadsheets or outputs, documenting report specifications, and maintaining reusable templates. These tasks often have visible inputs and repeatable formats. They are good candidates for assistance because the requested output can sometimes be described precisely and checked against an existing result.
The second group is data and system stewardship. O*NET includes collecting information, maintaining databases and tools, managing the timely flow of intelligence, creating or reviewing technical design documentation, and conducting or coordinating tests. This work is less glamorous than a new chart, but it determines whether the chart can be trusted. It includes decisions about source freshness, field meaning, access, joins, refresh behavior, versioning, and acceptance criteria. A generated answer cannot remove the need for those conditions. It can make a mistaken assumption harder to notice if nobody tests it.
The third group is interpretation. The profile names industry and geographic trend analysis, competitive market analysis, customer monitoring, and synthesis of intelligence to support recommendations. Interpretation is not a synonym for writing a paragraph about a graph. It involves choosing comparisons, noticing missing context, separating a signal from a data artifact, and judging whether a pattern is decision-relevant. A tool may offer candidate explanations. The analyst still has to determine whether those explanations are consistent with the data and the business setting.
The fourth group is the decision interface. BI analysts manage information flow, provide technical support, communicate with stakeholders, explain tools and metadata enhancements, and support recommendations. These activities make analysis usable. They also create friction for full automation because requests arrive with incomplete definitions, competing priorities, sensitive context, and a need for someone to explain tradeoffs. The interaction may happen in a meeting, a ticket, a written note, or a review of a dashboard. Its form changes, but the coordination problem remains.
O*NET's work-activity data reinforces the same pattern. The profile gives high importance to analyzing data, working with computers, processing information, interpreting information for others, obtaining information, communicating with colleagues, and making decisions or solving problems. It also records interpersonal relationships and consultation. These ratings are occupational descriptors, not percentages of a workday. They should not be converted into a personal automation score. Their value is structural: they show that exact processing and human-facing interpretation coexist in the same occupation.
The work context matters as well. O*NET reports that being exact or highly accurate is important for much of the occupation, that workers have some or a lot of freedom in setting tasks and goals, and that decisions can affect company results. It reports meaningful team contribution and regular communication. Those conditions increase the importance of verification and explanation, even when the underlying work is performed at a computer. They do not make the work immune to change. They change what a responsible workflow must include.
The Hot Technologies page should be read with similar care. It helps show that BI work is tool-mediated and connected to databases, reporting systems, programming or query environments, and visualization technologies. It does not mean every BI analyst needs every technology named there. It does not establish that a tool is currently used by every employer, nor that listing a technology creates hiring demand. A tool inventory is a clue about the surface on which work occurs, not a career prescription.
For your own task map, write down ten recent requests rather than an idealized job description. Put each under production, stewardship, interpretation, or decision interface. Then add the hidden work around it: clarifying the request, finding the source, checking permissions, testing a number, handling an exception, and explaining the result. If you only count the visible output, you will overstate the production layer. If you only count meetings and judgment, you will understate the amount of repeatable digital work that can be compressed.
This exercise also exposes a common mismatch between the formal role and the local role. A person called a BI analyst may mainly build dashboards, may act as a data product owner, may support sales operations, or may function as a reporting engineer. Conversely, someone with a business analyst title may perform the same query, reporting, and trend tasks. AI exposure follows the task bundle and the controls around it, not the label on the job board.
The practical implication is not to defend every task equally. If most of your month is standard production, faster generation may reduce the scarcity of that output. Your next investment should make the upstream and downstream parts visible: define the metric, maintain the semantic model, specify acceptance tests, document lineage, analyze exceptions, and carry the explanation into a decision. If those responsibilities are not available in your current team, the map gives you a concrete basis for a scope conversation or an adjacent search.
The task bundle also tells you which learning paths are proportionate. Someone who wants to use AI in an existing BI role may need stronger SQL reasoning, data quality, evaluation, privacy, and workflow design. Someone who wants to build data products may need deeper software practice. Someone drawn to optimization needs mathematics and modeling. Someone who wants management analysis needs a different client and process orientation. A short course may fill one gap. It cannot substitute for the work evidence required by a larger transition.
Sources: O*NET OnLine: Business Intelligence Analysts; O*NET OnLine: Hot Technologies for Business Intelligence Analysts
Which BI tasks are exposed first, and which tasks merely move upstream?
The clearest exposure zone is repeatable digital production. A system may draft a query from a plain-language request, suggest a transformation, turn structured results into a first-pass summary, generate documentation from a known procedure, or help configure a standard view. Whether it performs the task reliably depends on access, data quality, tool integration, and review. The point is not that every capability works everywhere. The point is that these task shapes are plausible targets for assistance because they have a digital artifact and a describable output.
A useful comparison is to separate the task from its surrounding responsibility. Query drafting is exposed. Choosing the correct tables, population, time window, and denominator may remain the analyst's work. Report formatting is exposed. Deciding which comparison is fair and whether a missing value changes the conclusion is not solved by formatting. Dashboard maintenance is exposed. Deciding which metric is authoritative and what a user is allowed to see is a stewardship problem. Documentation drafting is exposed. Confirming that the documented procedure matches the live system is verification.
The following table is best read as a decision aid, not as a prediction of what your employer will do. It describes a likely direction of pressure and the responsibility that tends to remain or move upstream.
Task: recurring report drafting. Likely AI mode: draft, summarize, or automate a stable template. Verification burden: compare source values, definitions, periods, and exceptions. Changed responsibility: decide which recurring view still matters and explain any deviation that should trigger action.
Task: query generation. Likely AI mode: translate a natural-language request into candidate SQL or another query form. Verification burden: inspect joins, filters, null handling, grain, permissions, and performance. Changed responsibility: turn an ambiguous business question into a precise specification and test the result against known cases.
Task: spreadsheet or data transformation. Likely AI mode: suggest formulas, code, mappings, or cleaning steps. Verification burden: preserve types, keys, missingness, and business rules. Changed responsibility: define the acceptable transformation and make the process reproducible rather than accepting a plausible output.
Task: dashboard configuration. Likely AI mode: recommend charts, filters, layout, or narrative annotations. Verification burden: check source freshness, aggregation, labels, accessibility, and whether the visualization encourages a wrong comparison. Changed responsibility: design an interface that supports a decision without hiding uncertainty.
Task: documentation. Likely AI mode: produce a first draft from code, metadata, or a prior document. Verification burden: compare with the actual pipeline, owner, refresh schedule, and exception path. Changed responsibility: maintain a living contract that a future user can act on, not simply a polished description.
Task: exploratory trend summary. Likely AI mode: identify candidate patterns, segment changes, or possible explanations. Verification burden: distinguish correlation from causation, check alternative slices, and investigate data collection changes. Changed responsibility: frame a question worth testing and communicate what the evidence does not establish.
Task: data-quality check. Likely AI mode: flag anomalies, missing fields, duplicate records, or unexpected shifts. Verification burden: decide whether a flag is a defect, a legitimate event, or a change in the source system. Changed responsibility: define thresholds, escalation, ownership, and the action that follows a failed check.
Task: metric and semantic-model design. Likely AI mode: suggest names, relationships, or definitions from existing artifacts. Verification burden: reconcile competing business meanings and test the model across use cases. Changed responsibility: own the semantic contract that prevents different teams from using the same word for different numbers.
Task: stakeholder elicitation. Likely AI mode: prepare questions, summarize a meeting, or propose a requirements draft. Verification burden: confirm what the stakeholder meant, what they can decide, and what constraints they omitted. Changed responsibility: resolve ambiguity and negotiate scope, timing, and acceptable uncertainty.
Task: recommendation. Likely AI mode: organize evidence, produce options, or draft a decision memo. Verification burden: check the evidence, assumptions, incentives, and consequences. Changed responsibility: make the reasoning auditable and say when the data is insufficient for a recommendation.
This is why the word upstream matters. When generation becomes cheaper, the scarce work may shift toward choosing the question, specifying the data, setting the test, and deciding what happens when the output fails. The shift is not automatic. An employer may instead ask for more reports in the same time, cut review, or centralize analysis in another team. The analyst needs to observe the local redesign rather than assume that better tools create better work.
The ILO's 2025 methodology helps explain why digitized professional work can show increasing theoretical exposure without a corresponding claim of whole-job automation. It uses task-level assessments and reports exposure gradients. Its result is a map of applicability and potential task change. It does not measure whether an organization has clean data, budget, governance, or willingness to alter responsibilities. Those organizational conditions are part of adoption and redesign, which a task exposure measure cannot settle.
Anthropic's observed-use analysis adds a second caution. Its published result says the data did not show jobs being entirely automated and that use was distributed across tasks. That does not prove that a BI workflow cannot be automated. It means that the observed pattern supports a task-level interpretation better than a binary occupation-level one. A BI analyst can see heavy change in report production while retaining, or even gaining, work in data contracts, evaluation, and decision support.
The strongest counterargument is straightforward. If data infrastructure becomes reliable, tool integration becomes deep, and an employer validates an end-to-end reporting agent, more of the chain can be automated than today's cautious examples suggest. That possibility should be taken seriously. It changes the recommendation for an analyst whose employer has actually deployed such a system and removed scope. It does not justify stating a present displacement probability for everyone with the title. The correct response is to watch for verified workflow redesign: changed permissions, changed review rules, fewer analyst-owned deliverables, altered staffing, and new accountability arrangements.
Do not use a generic list of supposedly safe tasks as the opposite error. Any task can change if the employer changes controls, interfaces, and incentives. Stakeholder communication can be summarized. Metric design can be assisted. Human judgment can be pressured by a system that presents a confident answer. The useful distinction is not safe versus unsafe. It is low or high verification burden, low or high consequence, reversible or hard-to-reverse error, and clear or ambiguous responsibility.
For the reader, the task list has one immediate use. Circle the production tasks that could be compressed, then write the upstream and downstream questions that make them trustworthy. If you cannot name the source, definition, test, owner, and decision for a report, your next learning project should not be a broad AI survey. It should be a small workflow that teaches you to control those points. That is how exposure becomes evidence about what to learn rather than a reason to panic.
Sources: O*NET OnLine: Business Intelligence Analysts; O*NET OnLine: Hot Technologies for Business Intelligence Analysts; ILO: Generative AI and Jobs: A Refined Global Index of Occupational Exposure; Anthropic: Introducing the Anthropic Economic Index

Why is the same AI capability useful for one BI task and risky for another?
A generated answer can be useful and risky for the same reason: it is fast enough to enter a real workflow before its limits are fully visible. In business intelligence, a draft query that saves time may also select the wrong grain. A summary that makes a trend easy to read may quietly turn association into explanation. A dashboard assistant may produce a clean chart from stale data. The right question is not whether the system is impressive. It is whether the task has a clear specification, accessible inputs, reversible errors, and a verification step that a qualified person can actually perform.
NIST's AI Risk Management Framework gives a useful discipline for thinking about that problem. The framework organizes risk work around governing, mapping, measuring, and managing. It treats governance as continuous and says that documentation can support transparency, human review, and accountability. The framework is not a career syllabus for BI analysts, and using it does not turn an analyst into a governance specialist. It does provide practical questions for any analyst who is evaluating an AI-assisted workflow.
Start with mapping. What is the intended use? Which users and decisions are affected? What data enters the system? What data must not enter it? Who owns the output? What happens if the result is wrong? In a low-stakes internal report, an error may be corrected before anyone acts. In a report that informs eligibility, resource allocation, pricing, compliance, or a public commitment, the same kind of error can have a larger consequence. The consequence is a property of the use case, not a permanent property of the model.
Then measure the failure modes that matter. A query may return a number but use a duplicate join. A narrative may accurately describe a chart but omit a major data break. A classifier may flag an anomaly because the source system changed its format. A retrieval system may use an old definition of a metric. A tool may expose confidential fields through a prompt, log, or shared output. Measurement does not require a grand benchmark. It can begin with a fixed test set, known examples, source comparisons, and a record of errors that a reviewer could realistically detect.
Finally, manage the workflow. Define when AI assistance is allowed, when a human must review it, which fields are restricted, how changes are recorded, and what happens when the system is uncertain. A sign-off rule is not a ritual. It should identify the person with enough context and authority to check the output. If the reviewer lacks time, access, or domain knowledge, the existence of a human in the process does not guarantee meaningful oversight.
This is where a BI analyst can become more valuable without claiming immunity. The analyst can connect a technical capability to a business control. They can turn a vague instruction such as “use AI for reporting” into a named workflow with inputs, acceptance tests, exception handling, and an owner. They can compare time saved with review time added. They can document why a workflow should remain assisted rather than delegated. Those are concrete contributions even when the analyst is not building a model.
The NIST Generative AI Profile adds a further boundary. It describes risk as combining the likelihood of an event with the magnitude of its consequences and notes that risks vary by lifecycle stage and system scope. That supports a practical warning: a tool demonstration is not evidence of reliable autonomous performance in a production workflow. The same model behavior can be acceptable for a draft internal note and unacceptable for an externally delivered report with contractual consequences.
Anthropic's research also needs careful use. Its Economic Index separates automation, where the system directly performs part of a task, from augmentation, where it collaborates with a user. The published analysis is about conversations with one AI service and does not measure a BI team's productivity, quality, or adoption. It is still helpful for the concept of mixed modes. A worker can use an assistant to draft a transformation, inspect it, edit it, and remain responsible for the result. The task has changed without becoming an autonomous job.
Microsoft's 2025 Work Trend Index shows why reported organizational intent should not be confused with adoption. The page describes a survey of 9,037 leaders, including a subset it calls Frontier Firm leaders, and reports that leaders are considering several workforce strategies, including skilling existing workers, using AI as digital labor, and reducing headcount. This is a survey of reported plans and beliefs, with a sponsor-defined category. It can show that organizations are considering different responses. It cannot show that a particular BI employer has made a decision or that the decision will occur as described.
A BI analyst should therefore track observable workflow signals rather than survey mood. Are you being asked to review machine-generated output? Are review deadlines shrinking? Is your team receiving new responsibility for data quality or evaluation? Are definitions being centralized? Are analysts expected to create more outputs with the same staff? Are permissions and escalation paths documented? Has a production deliverable moved to another group? These signs say more about local adoption and redesign than a general claim that AI is powerful.
Consider an example with a weekly revenue report. The first experiment is not to let a system send the report automatically. It is to ask for a draft query and explanation on a copy of the data, compare it with the existing query, run known edge cases, inspect the denominator, and document every correction. If verification takes longer than the original work, the pilot has still produced evidence. The correct conclusion may be that the workflow needs better data definitions or that the tool is useful only for documentation. A failed pilot is not a failed career; it is a boundary around a capability.
A second example is a dashboard that combines customer activity from two systems. A tool may suggest a join and produce an attractive view. The analyst must decide whether the keys represent the same entity, whether the time windows match, whether records are duplicated, and whether access rights permit the combination. The visual surface can be generated while the semantic risk remains. If no person can explain the join, the output is not made trustworthy by being easy to read.
The strongest alternative view is that continued improvements will reduce verification costs enough that most of this responsibility becomes routine. That may happen in some workflows. A mature data catalog, stable definitions, strong tests, controlled access, and a known decision can make delegation more plausible. The conclusion should then move with the evidence. An analyst who can help establish those conditions may shift from making each report to designing, monitoring, and improving the reporting system. An analyst whose employer has completed the transition should assess whether their current role still includes meaningful ownership.
The practical rule is simple. The clearer the specification, the more accessible the inputs, the cheaper the verification, and the more reversible the error, the more reasonable it is to test AI assistance. The more ambiguous the metric, sensitive the data, consequential the decision, or hidden the failure, the more the workflow needs explicit human judgment, documentation, and monitoring. This is not a promise that human review catches everything. It is a way to allocate attention where an attractive output has the most room to mislead.
Use the rule to choose a first learning project. Do not begin with a broad claim that you need to master every new tool. Begin with one named workflow and learn the durable parts: problem framing, query reasoning, data literacy, evaluation, verification, privacy, and basic automation. Tool interfaces will change. The ability to define an acceptance test and explain a result to a stakeholder will remain useful across those changes.
Sources: NIST AI Risk Management Framework Core; NIST AI RMF: Generative Artificial Intelligence Profile; Anthropic: Introducing the Anthropic Economic Index; Microsoft Work Trend Index 2025: The year the Frontier Firm is born
Which realistic move should come next?
For most readers who still have access to business questions and stakeholders, the first move should be an upgrade of the existing BI role. Become the person who can use AI in a named workflow while preserving metric meaning, data quality, evaluation, privacy, and decision communication. This is not a claim that the path is guaranteed or that every employer rewards it. It is a proportionate response when the reader already has domain knowledge and some authority over the task bundle. It protects useful experience while testing whether the local role can expand.
An upgrade is not the same as adding a tool to your résumé. It should produce an artifact that another person can inspect. That artifact might be a documented report workflow with acceptance tests, a semantic-model change with definitions and lineage, a data-quality monitor with escalation rules, a comparison of AI-assisted and existing processes, or a short decision memo that states assumptions and uncertainty. The tool is secondary. The evidence is that you can improve a real workflow without making its risks invisible.
A bounded learning sequence for this path begins with the task map. Next, strengthen the foundations the workflow needs: SQL and query reasoning, data modeling, data quality, evaluation, versioning, privacy, and basic automation. Then run a small project with a fixed input, a known baseline, and a review procedure. Add tool-specific knowledge only where the project requires it. A certificate or course may give structure and feedback. It does not replace a work-based artifact, and completion does not establish readiness for data science or machine-learning engineering.
The second move is an adjacent path into computer systems analysis. The Bureau of Labor Statistics describes computer systems analysts as people who study an organization's systems and design or implement improvements aligned with business goals. Its profile emphasizes business understanding, communication between management and IT, attention to detail, and coordination. For a BI analyst who enjoys requirements, systems, testing, and user training more than recurring reporting, that can be a credible direction because it preserves part of the existing experience while changing the task mix.
The adjacent move still has costs. It may require stronger systems analysis, requirements practice, architecture vocabulary, project coordination, and software-life-cycle understanding. A certificate may help signal a structured transition, but an employer will still want evidence that you can elicit needs, specify a change, test it, and communicate tradeoffs. BLS occupational information can describe the work and entry expectations. It does not establish that a particular city is hiring, that a particular salary will transfer, or that the occupation is protected from AI.
The third move is operations research. BLS says operations research analysts typically need at least a bachelor's degree and that some employers require or prefer a master's degree. It describes a field rooted in quantitative analysis, with coursework in mathematics and computer science, and highlights forecasting, data mining, communication, critical thinking, and mathematical modeling. This can fit a BI analyst who wants to move from describing what happened toward optimizing decisions under constraints. It is not a short AI pivot. The mathematics and modeling prerequisites are part of the decision.
A fourth option is management analysis. BLS describes management analysts as people who interpret information and use findings to make proposals, often after gaining related work experience. The page notes that analysts may spend substantial time with clients and may travel or work under tight deadlines. That matters for a reader with family, health, location, or schedule constraints. The apparent closeness of the title does not erase the work-style change. A move into consulting can preserve business experience while increasing client demands and the need to sell a recommendation.
A fifth option is data science or machine-learning engineering. Treat this as a larger change because the goal is different. BLS says data scientists commonly need at least a bachelor's degree and that some roles require a master's or doctoral degree. It describes substantial study in mathematics and statistics, programming, algorithms, databases, and model development. Someone who genuinely wants to build and evaluate models may choose this path. Someone who only wants to remain employable as a BI analyst does not need to assume that the largest technical transition is mandatory.
Compare the paths against six constraints. First, how much existing experience transfers? An upgrade preserves the most. Systems analysis and management analysis preserve some while changing the interface. Operations research and data science require more quantitative depth. Second, what prerequisites are non-negotiable? A project may reveal whether you enjoy the work, but it does not waive mathematics or programming requirements. Third, how much learning time can you sustain alongside work, health, and family? A plan that cannot be maintained is not a realistic plan.
The comparison should include the kind of feedback each path gives you. Self-study is useful when the gap is narrow and you can judge your own work against a clear standard. It is weaker when you do not yet know what good requirements, data models, statistical reasoning, or production code look like. A short course can provide sequence and deadlines, but its certificate is not the same as workplace capability. A project gives stronger evidence when it has a real user, defined inputs, tests, documentation, and a result that can be defended. An apprenticeship, supervised assignment, or internal rotation can add the feedback a personal project lacks, although availability and access vary. A degree offers broader foundations, accumulated practice, and a formal signal, but it also asks for more time, money, and opportunity cost. The choice should follow the transition you are trying to make, not the prestige of the format.
There is also a difference between learning a concept and learning an interface. Concepts such as grain, lineage, sampling, evaluation, access control, error analysis, and causal caution remain useful when a vendor changes its product. A button, prompt pattern, or brand-specific workflow may be useful for a current project and still have a short shelf life. For an analyst with limited time, the durable concept should come first. Learn enough of a tool to test the workflow, then ask whether the skill transfers to another environment. This approach is not anti-tool. It is a way to avoid spending scarce evenings collecting interfaces without gaining the ability to judge their outputs. It also leaves room for a targeted course when the course teaches a concrete foundation and offers meaningful feedback.
The same discipline applies to credentials. Before enrolling, write the work outcome the program is meant to support, the prerequisite it assumes, the artifact you will produce, and the feedback you will receive. If those answers are vague, delay the purchase and run the smaller project first. The project may show that you need a course, or it may show that the real blocker is access to reliable data or a manager willing to change scope. That is useful information because it prevents a credential from being asked to solve an organizational problem it cannot solve.
Fourth, what kind of signal is needed? A course can demonstrate organized learning. A certificate can provide a recognizable label, subject to the credibility and relevance of the provider. A project demonstrates application when the project is real, specific, and explainable. A degree offers depth, sequencing, feedback, and a broader signal, but at greater time and cost. Self-study can be efficient for a narrow gap and weak when the learner needs external feedback or a new professional network. Apprenticeship or supervised work can provide feedback and context where available. No format has the same value for every transition.
Fifth, what geography and salary floor constrain the move? U.S. BLS data are national occupational descriptions and projections, not a local forecast. Do not use an occupation's median wage as a promise or assume a title change preserves income. Compare actual postings, requirements, commute or remote conditions, and the employer types available to you. Sixth, what degree of task-bundle change do you want? If you dislike stakeholder ambiguity and prefer technical construction, management analysis may be the wrong adjacent move even if the title sounds familiar. If you value business context, a pure engineering path may be unnecessarily distant from your strengths.
A decision rule can make the comparison usable. Upgrade the BI role if at least two high-value responsibilities remain within reach, you can run a credible low-stakes pilot, and someone with authority can act on the result. Investigate an adjacent path if routine production dominates, your employer does not let you own redesign, and another task bundle fits your interests and constraints. Consider larger retraining if the desired work itself requires deeper mathematics, programming, or systems practice and you can fund the learning time without treating a credential as a guaranteed outcome.
Do not let exposure evidence make the decision by itself. Occupational exposure is not occupational growth, and an occupation with lower measured exposure may still have poor fit, weak local demand, or conditions you cannot accept. Conversely, a highly digitized occupation may create opportunities for people who can improve workflows. The useful question is whether you can connect your existing experience to a changed need in a market and environment you can realistically enter.
For most BI readers, the next learning step is smaller than a degree decision. Map one task bundle. Run one bounded pilot. Produce one artifact showing how you tested it. Then speak with a manager, colleague, or target employer about the responsibility you want to own. If that evidence points toward systems, optimization, consulting, or model development, investigate the prerequisites for that path. This sequence prevents both underreaction and an expensive leap made only to escape a frightening headline.
Sources: O*NET OnLine: Business Intelligence Analysts; U.S. Bureau of Labor Statistics: Computer Systems Analysts; U.S. Bureau of Labor Statistics: Operations Research Analysts; U.S. Bureau of Labor Statistics: Management Analysts; U.S. Bureau of Labor Statistics: Data Scientists; O*NET OnLine: Operations Research Analysts

What should I measure in the next 30 days, and what would change the recommendation?
Measure the workflow before buying a credential or announcing a career change. For a representative month, record the tasks you actually perform, how often they recur, how structured their inputs are, how much clarification they require, how long verification takes, how serious an undetected error would be, who must approve the result, and whether the work affects a decision outside your immediate team. Add one more field: what changed after the output was delivered. That last field separates reporting activity from decision ownership.
In days 1 through 7, inventory the task bundle. Select several recurring reports, dashboard requests, queries, data-quality checks, stakeholder questions, and recommendations. Do not choose only your easiest tasks. Mark each as production, stewardship, interpretation, or decision interface. Record the source systems, definitions, permissions, review steps, and exceptions. Note constraints that a career plan must respect, including salary floor, location, schedule, health, family, and available learning time. The goal is not to create a perfect database of your work. It is to prevent a vague fear from standing in for evidence.
In days 8 through 30, select one low-stakes workflow. Define a baseline using the existing process. Write what a correct result must contain, which values can be checked, what information must remain private, and who signs off. Compare an AI-assisted draft with the baseline, not only by elapsed minutes but by correction time, missed issues, clarification requests, and review burden. Keep an error log. If the result is faster but harder to verify, say so. If it saves little time but produces useful documentation, that is also a valid finding.
The pilot should have a stopping rule. Stop using the assisted process if it produces an error the reviewer cannot reliably detect, exposes restricted information, changes a metric without an approved definition, or creates a review burden that exceeds the value of the output. A stopping rule is evidence of judgment. It is more persuasive in a training request than a statement that you are enthusiastic about AI, because it connects experimentation to responsibility.
In days 31 through 60, turn a successful experiment into a controlled workflow. Document the purpose, inputs, owner, tool boundary, acceptance tests, known failure modes, escalation route, and version changes. If the pilot failed, document why. The failure may point to bad source data, unclear requirements, insufficient access, weak tool performance, or a task that should remain manual. Each explanation suggests a different response. A course may help with technical skill. A data contract may solve the underlying problem. A scope conversation may be more important than either.
In days 61 through 90, use the evidence to choose among three actions. First, request a scope change that makes your role responsible for evaluation, data quality, definitions, or workflow design. Second, choose a targeted course or project that closes the exact gap the pilot revealed. Third, compare adjacent roles using real requirements and constraints. Do not present the pilot as proof that you are ready for a new occupation. Present it as evidence of a capability, a limit, and a next question.
What would change the upgrade-first recommendation? One condition is verified employer-level redesign that removes or materially reallocates BI responsibilities. Look for observable evidence, not rumors: an end-to-end system in production, reduced analyst-owned deliverables, changed review rules, new permissions, altered staffing, or a formal transfer of accountability. Another condition is lack of authority. If you cannot access the data, change the process, or receive credit for the responsibility, the best path may be an external search or an adjacent role. A third is preference. If the work you want is fundamentally different, exposure may simply be the prompt to pursue it deliberately.
The BLS projections table can help frame occupational research, but it must be read within its boundary. Projection data describe expected employment change for occupations under a stated U.S. modeling framework. They do not predict the outcome for one worker, one employer, or one location. Use them to compare the broad nature and requirements of possible paths, then check local postings and actual work conditions. Never turn a projection into a guarantee or a safe-job label.
The free AI Proof Work checker can be useful after this inventory. It provides transparent task-level change-pressure signals and first actions. It does not produce a validated probability of displacement, and it does not know every constraint unless you supply them. Its value is to give structure to the task map and make the assumptions visible. Use the result as a prompt for the pilot, not as a verdict about your future.
The paid career roadmap is a different step for someone who needs a comparison across constraints. It can compare a stay-and-redesign path, adjacent pivots, and a larger-change scenario around experience, salary floor, geography, learning time, and other stated limits, then organize a 30/60/90-day plan. It does not guarantee employment or income, choose a universally correct career, or replace professional advice for high-stakes decisions. The information needed to make a useful comparison belongs in the reader's real situation, not in a frightening score.
Return to the opening Monday. The recurring report, query, or dashboard is not proof that your occupation is safe, and it is not proof that your occupation is ending. It is a bundle of tasks with different levels of exposure, verification cost, consequence, and human responsibility. The proportionate action is to identify one task that can be tested, preserve the checks that make it trustworthy, and use the result to negotiate or investigate the next responsibility.
My final verdict is therefore conditional. Do not leave BI merely because the role is digital and exposed. Upgrade first when you can move toward trusted decision ownership. Move adjacent when production work is being compressed and authority is absent. Retrain more deeply when you want a different kind of work and can meet its prerequisites. The condition most likely to change that verdict is not a new headline about capability. It is evidence that your employer has redesigned the workflow and changed what analysts are accountable for.
Sources: O*NET OnLine: Business Intelligence Analysts; NIST AI Risk Management Framework Core; U.S. Bureau of Labor Statistics: Occupational projections and worker characteristics
Questions readers ask
Does AI exposure mean business intelligence analysts will lose their jobs?
No. Exposure means that some tasks are technically applicable to current AI capabilities. It does not measure employer adoption, workflow redesign, labor demand, or an individual's probability of displacement. BI production tasks may be compressed while data definition, testing, interpretation, and decision support remain or change form.
Which business intelligence analyst tasks are most exposed to AI?
Repeatable digital production is the clearest exposure zone: recurring reports, query drafts, data transformations, dashboard configuration, standard documentation, and first-pass summaries. The surrounding work still requires checking joins, definitions, lineage, permissions, exceptions, and consequences.
What should a BI analyst learn first instead of becoming a machine-learning engineer?
Start with the workflow you already own. Strengthen problem framing, SQL and data reasoning, semantic modeling, data quality, evaluation, privacy, verification, and basic automation. Run one low-stakes project that produces an inspectable artifact. Choose deeper statistics, software, or machine-learning study only when that is the work you actually want.
Is moving into data science the best response to BI exposure?
Not automatically. Data science is a larger transition with stronger expectations around mathematics, statistics, programming, algorithms, and model development. It can fit someone who wants that work, but it is not required for every BI analyst who wants to adapt. An upgrade or systems-analysis path may preserve more experience with less task-bundle change.
How can I test AI in BI work without putting important reporting at risk?
Choose a low-stakes recurring workflow, use approved data, define a fixed test set and acceptance criteria, compare the assisted result with the existing baseline, record errors and review time, and require human sign-off. Stop if the output changes definitions, exposes restricted data, or creates errors the reviewer cannot reliably detect.
Should I use the AI Proof Work checker for my BI role?
You can use the free checker after listing your actual tasks and constraints. It provides transparent task-level change-pressure signals and first actions, not a validated displacement probability. For a scenario comparison across an upgrade, adjacent path, and larger change, the paid roadmap can organize options around your experience and practical limits, but it does not guarantee employment or income.
Sources and notes
- O*NET OnLine: Business Intelligence Analysts
Defines the occupation's core tasks, work activities, work context, testing, reporting, trend analysis, communication, and decision-support boundaries.
- O*NET OnLine: Hot Technologies for Business Intelligence Analysts
Supports the description of BI work as a deeply digital, software-mediated workflow without establishing universal tool use or hiring outcomes.
- ILO: Generative AI and Jobs: A Refined Global Index of Occupational Exposure
Supports the task-level exposure method and the boundary between exposure gradients and individual displacement probabilities.
- Anthropic: Introducing the Anthropic Economic Index
Supports the distinction between observed AI use, automation, augmentation, and uneven task-level use rather than whole-occupation automation.
- NIST AI Risk Management Framework Core
Supports translating governance, mapping, measuring, managing, documentation, human review, and accountability into BI workflow checks.
- NIST AI RMF: Generative Artificial Intelligence Profile
Supports the distinction between capability demonstrations and reliable production performance, and the importance of context, lifecycle, and consequence.
- Microsoft Work Trend Index 2025: The year the Frontier Firm is born
Supports the boundary around survey-reported organizational strategies and expectations; it does not establish adoption or redesign at a particular employer.
- U.S. Bureau of Labor Statistics: Computer Systems Analysts
Supports the adjacent-path description of systems analysis, business goals, communication between management and IT, requirements, and testing.
- U.S. Bureau of Labor Statistics: Operations Research Analysts
Supports the prerequisites and work characteristics of operations research, including mathematics, modeling, forecasting, communication, and problem solving.
- U.S. Bureau of Labor Statistics: Management Analysts
Supports the adjacent management-analysis path, typical education and experience expectations, client contact, travel, and deadline constraints.
- U.S. Bureau of Labor Statistics: Data Scientists
Supports the larger-transition description of data science prerequisites in mathematics, statistics, programming, algorithms, databases, and model development.
- O*NET OnLine: Operations Research Analysts
Supports the related-occupation comparison between BI reporting and quantitative modeling, analysis, optimization, and decision support.
- U.S. Bureau of Labor Statistics: Occupational projections and worker characteristics
Supports the caution that occupational projections are broad U.S. directional evidence, not individual, employer, or local employment guarantees.
Apply this to your own work
See the whole job market at once.
Explore which occupations AI may reshape, then turn the signal into a practical response.
Explore the job map