
Google’s September 15, 2026 ATLAS release added an interactive explorer and reported a separate study of scientists’ AI use. Neither shows job displacement: ATLAS describes interactions with covered Google products, while the scientist study reports findings from a selected U.S. and U.K. sample. As Google’s ATLAS methodology, the ILO’s exposure index, and U.S. Bureau of Labor Statistics guidance each illustrate in different ways, use, modeled exposure, employer adoption, and employment outcomes are separate measures. Treat the view as a prompt to investigate a recurring task in your own workplace; a displacement claim needs evidence linking a defined deployment to workflow and staffing changes over time.
What changed in Google’s September 2026 release?
Google’s September 15, 2026 release added an interactive explorer for its AI & Economy ATLAS and announced separate research on AI use in science. The explorer makes existing ATLAS views easier to inspect by country, occupation, and use at home, while the science report brings a different kind of evidence: survey responses and analysis of specialized AI models. Neither addition measures job displacement. The date matters because the new interface is a way into data whose collection design was already defined; it is not a new employment dataset.
In “New insights from Google’s AI & Economy ATLAS,” Google illustrates the explorer with patterns such as India’s share of work-related AI use in arts, design, and media, and activity associated with computer and mathematical occupations in the United States. Those examples show how use is distributed within the covered interactions. They can help a reader see where activity appears in the data and formulate questions about task change. A chart that is easier to explore still describes the underlying records and classifications; it does not add observations of hiring, layoffs, hours, or employer decisions.
The same announcement separately presents “AI in Science: Early Insights.” That report examines scientific work through survey and model-use evidence, so it can speak to reported workflow changes in its study context. It should not be folded into the explorer’s country and occupation charts as if both were a single measurement. The article therefore follows two tracks: first, what the ATLAS interaction data can show and how its scope shapes the charts; second, what the science study reports about a particular workflow. Both may illuminate changing work, but neither turns visible AI activity into a count of jobs displaced.
The release date separates what was newly available from what ATLAS had already measured. Google announced an explorer for existing ATLAS data, not a new worker panel or series of job records. Direct navigation makes comparisons easier, but a view should not be read as change over time unless its measure and observation periods support that comparison. The news is improved access plus a separate science report, each answering a different question.
The interface has real value: opening the data to more direct inspection can make its comparisons more usable and its examples easier to question. The important boundary is that visibility is not a new employment variable. To interpret any chart, start with what ATLAS counts and covers; to assess a claim about jobs, look for employment evidence of a different kind.
What does an ATLAS interaction represent?
An ATLAS interaction is an aggregated, de-identified record of activity in a product Google included in its dataset. In “Understanding the AI economy,” Google says ATLAS v1.0 covers interactions from Gemini App, AI Mode, and Gemini API. Google reports a corpus of 15 million interactions, mapped across more than 150 countries, 140 languages, 800 occupations, and 4,000 tasks. These figures describe the size and classification reach of the corpus, not a count of workers or workplaces represented.
The distinction matters because the unit is an interaction, not a person. One person may generate multiple interactions, and the corpus does not establish how many unique workers appear in it. Nor is an interaction necessarily a complete episode of work: it records activity captured by the covered product, not every step before or after that exchange. A record mapped to an occupation or task is therefore evidence that activity was classified in that way under Google’s method. It is not a worker-level observation that the whole occupation performs that task, or that the task has been removed from someone’s job.
The product boundary is also consequential. Google’s v1.0 description identifies Gemini App, AI Mode, and Gemini API as the covered sources. It acknowledges that other economically relevant products and enterprise platforms are outside this initial scope. Consequently, the corpus cannot stand for all generative AI use, all workplace software, or all organizational deployment. If a worker or employer uses another system, that activity will not appear merely because it involves AI. Even within the named products, the data capture recorded interactions rather than every use or non-use in a company’s workflow.
Google’s mapping supplies breadth across countries, languages, occupations, and tasks, but those categories remain a classification layer applied to interactions. Occupations summarize varied jobs, and task labels make a very large corpus more legible; neither removes differences in seniority, sector, employer process, or the share of a worker’s time spent on each activity. A mapped record can locate a kind of interaction in the taxonomy, but it cannot reconstruct the full task bundle or surrounding responsibility from the label alone.
The denominator requires similar care. When Google reports a share of work-related activity or a share associated with a category, the denominator is the relevant set of interactions defined for that analysis, not all working people, all work hours, or all jobs in a country. A larger share within that pool may reflect more recorded activity of a type relative to the pool; by itself it does not show that a larger proportion of workers use AI, or that the activity is common across employers. The interaction count cannot be converted into a workforce prevalence rate without a suitable worker-level sampling frame and a measured relationship between records and people.
Google also classifies workplace interactions by task and use. The methodology reports that under 10% of workplace interactions are classified as fully automating tasks. That is a characterization of interactions under Google’s categories, not a finding that under 10% of workers, jobs, or hours are automated. The categories concern how the recorded interaction is assessed; they do not reveal whether a person reviewed its output, whether an employer incorporated it into a process, or whether staffing changed. Reading the statistic at its stated unit preserves what it can contribute without converting it into an employment estimate.
Google describes the corpus as aggregated and de-identified, which is relevant to how it presents the data and to its privacy framing. Aggregation and de-identification do not solve the separate coverage question: a privacy-protective dataset can still omit products, users, and work that fall outside its collection frame. Likewise, broad geographic and linguistic coverage is valuable for examining activity across a wider range than a single organization could offer, while not making the corpus a representative census of work. Coverage breadth and population representativeness are different properties.
The useful reading is therefore specific: ATLAS v1.0 provides a large, multilingual view of classified interactions in three named Google products, within Google’s stated method and denominator. It can reveal patterns in that view and support questions about where recorded activity occurs. It does not count unique workers, comprehensively sample work, document organization-wide adoption, or record jobs gained and lost. Those boundaries are not reasons to ignore the data; they define the scale of claims the data can support.
Sources: Understanding the AI economy
What can country and occupation comparisons tell a worker?
Google’s “New insights from Google’s AI & Economy ATLAS” presents country and occupation comparisons as patterns in activity recorded by the products included in ATLAS. Read them as a map of where covered interactions appear concentrated, not as a ranking of how many workers use AI or how likely a country’s jobs are to disappear. The distinction starts with the denominator: the percentage describes a share within a defined interaction pool or subset of that pool. It does not use all employees, all working hours, or all organizations in the country as its denominator.
That narrower reading still has practical value. A worker can use a country or occupation contrast to identify where recorded use is visible in Google’s data, then ask whether similar tasks occur in their own work. A concentration associated with an occupational group can point to activity worth inspecting: perhaps requests involve drafting, analysis, coding, or another task classified under that occupation. The chart can help locate a question for a local task review. It cannot tell the reader what fraction of people with that job title use a tool, how often they use it, or whether it replaced a step in a paid workflow.
An interaction share is shaped both by activity and by the frame that captures it. Google’s ATLAS v1.0 methodology limits its corpus to the products named in the release and acknowledges other products and enterprise platforms beyond that initial scope. If a country’s workers rely on different tools, or organizations in one place provide different systems, some work-related AI activity will be less visible in this corpus. Differences in product access may therefore affect the patterns. That is a methodological possibility based on the collection boundary, not a cause Google establishes for any particular country contrast.
Language and classification also matter to interpretation. ATLAS maps interactions across many languages and occupations, but a mapped label remains the result of a classification process. Work practices, vocabulary, and the kinds of tasks people bring to a product may vary across contexts; a category that groups activity into an occupation cannot reveal the full role or industry behind an exchange. These factors are reasons to be careful when comparing shares. The published comparison by itself does not demonstrate that language or classification differences produced the observed pattern.
The denominator can shift the meaning. A larger category share might reflect more interactions in that category, fewer elsewhere, or a different mix of covered users and products. It does not establish that more workers in the occupation use AI; that estimate needs a worker sample and a measure linking people to use. Country-associated activity also does not reveal whether use was employer-approved, informal, or otherwise contextual unless the measure says so. Before treating a difference as prevalence, check whether numerator and comparison pool contain comparable interactions and products.
So use these comparisons to orient inquiry, not to decide that a role or national workforce is already undergoing a particular employment change. They can surface hypotheses for workers and researchers: which recorded task categories merit closer examination, or whether a pattern deserves follow-up with locally relevant evidence. Their uncertainty does not make them meaningless. It limits the conclusion to what the comparison actually observes—variation inside Google’s covered interaction pool—while leaving population prevalence, organizational adoption, and employment consequences open.
What does the scientist study add—and what does it leave open?
Google’s “AI in Science: Early Insights” adds a workflow study to the interaction patterns described above. It draws on three distinct evidence streams: an online panel of 637 scientists in the United States and United Kingdom fielded in July and August 2026; analysis of 2,600 specialized AI models; and ATLAS activity categorized by a taxonomy of scientific use. These streams answer related but different questions. The panel records scientists’ reported practices and time changes, the model analysis examines a set of specialized models, and the taxonomy organizes interactions. They should not be read as one sample or as a census of scientific work.
Within the panel, most respondents said they used AI daily for at least one scientific task and estimated saving just under seven hours in a typical week. This is self-reported time from surveyed participants, not timed observation or an independently measured increase in output. It describes what these respondents say they experience; it does not establish that scientists generally save the same amount or that saved hours become additional research capacity. Participants may count drafting, searching, coding, or other activities differently, and the estimate does not assess the quality or completion of resulting work. Treat it as perceived time released in this panel, not a standardized productivity metric.
Verification means checking whether an AI-assisted result is accurate, relevant, supported, and safe to use. In research, this can mean inspecting sources, testing code or analysis, checking an explanation against data, or deciding whether a result merits further investigation. Such checks can offset initial time savings, with the burden depending on the task and consequences of error. Google describes verification as part of scientists’ workflows but gives no universal net-time figure after review. A rough search aid may need less scrutiny than a claim entering a paper, clinical workflow, or resource-allocation decision. The evidence supports verification work in the studied workflow, not a fixed verification cost for every use.
Google’s report and the MIT FutureTech publication record also describe a tension between faster generation of candidate ideas and the capacity to test them. The study reports a backlog of hypotheses or ideas awaiting investigation, alongside constraints that depend on physical experiments and clinical validation. These stages require resources, access, and procedures that text or model generation alone does not provide. A model may help a researcher formulate or prioritize a possibility, but the possibility remains unconfirmed until suitable evidence is gathered. Where validation capacity is limited, a larger supply of candidates can increase the queue rather than produce discoveries at the same rate.
A bottleneck is the stage that most constrains the pace of a connected process. If literature review or drafting becomes faster while experiment setup, data collection, replication, clinical review, or equipment time remains scarce, the binding constraint can move downstream. In that case, upstream productivity may rise without a matching rise in end-to-end throughput—the amount of work that reaches a completed, usable result over a period. The study’s reported savings and its description of validation demands can therefore coexist: time may be freed in some activities while other stages determine how much research is finished.
That process-level interpretation is more informative than a generic count of AI interactions because it connects reported use to work stages and constraints. It still must be kept distinct from claims about discoveries, output, or employment. Just-under-seven-hour self-reported savings do not by themselves establish seven additional hours of completed science, a measured increase in discoveries, or fewer research positions. Nor does a backlog prove that AI caused a delay; the report identifies a workflow condition, while establishing its causes and scale would require more evidence. The useful inference is conditional: if AI accelerates an upstream task but validation resources do not expand, the downstream stage may become more limiting.
The report’s several methods add texture but do not remove the sample boundary. The panel consists of 637 U.S. and U.K. scientists recruited through a third-party online panel over two months, not a representative sample of all scientists, disciplines, countries, or workers. Responses are self-reports and may reflect who joined the panel and how participants interpreted questions about typical time saved. Specialized-model analysis and ATLAS classifications are separate observational material; neither turns the survey into a controlled productivity experiment. Google and MIT FutureTech frame the results as early insights into scientific workflows, not as a labor-market estimate or a forecast of staffing.
For a worker, the study supports a specific question: if AI makes one stage quicker, what later step still requires human judgment, external evidence, physical access, or formal validation? That question can reveal why assistance may change the composition and pacing of a workflow without translating directly into equivalent output or reduced headcount. The answer will vary by scientific process and resources. In this selected sample, reported time savings are worth taking seriously as reported experience; extending them to a general claim about productivity or jobs would go beyond what the study measures.
Sources: AI in Science: Early Insights; AI in Science: Early Insights
How does modeled exposure differ from ATLAS use?
A job can rank as exposed in the International Labour Organization’s model without showing up in Google’s ATLAS interaction data because the two measures ask different questions. The ILO estimates whether tasks could be affected by generative AI; ATLAS records interactions Google classified within its covered products. Potential applicability can exist before workers have access to a tool or choose to use it. Conversely, recorded interactions can occur in a task that an occupational model does not rate highly, because a person may use AI experimentally or in a narrow context that a broad task assessment cannot capture. Disagreement is therefore expected, not evidence that one measure has disproved the other.
In “Generative AI and Jobs: A Refined Global Index of Occupational Exposure,” the ILO describes an index built around nearly 30,000 tasks. The researchers combine task data with expert assessment and AI predictions, then aggregate task-level judgments into occupational exposure gradients. The model’s unit of reasoning is the task: how applicable generative AI appears to that activity, given the assessment approach. An occupation’s position summarizes the tasks associated with its occupational classification. It is not a direct observation of an individual worker’s week, and it cannot show what share of a particular person’s workload consists of each task.
This design gives exposure modeling a useful forward-looking role. A task can be technically amenable to assistance or automation even when no worker in a particular setting has adopted a tool. That makes a modeled signal useful for deciding what to inspect early: recurring text transformation, information extraction, or other digital activities may merit a closer look at reliability, review needs, and workflow fit. The model can flag a capability question before broad use becomes visible. Yet technical applicability is not the same as dependable performance in a production setting. A task assessment cannot by itself establish accuracy on an employer’s data, integration with existing systems, or whether a human must check the result before it can be acted on.
ATLAS answers a more observational question. “Understanding the AI economy” describes Google’s classified interactions across Gemini App, AI Mode, and Gemini API. When activity is mapped to an occupation or task, the data indicate that an interaction occurred and was classified there under Google’s method. They do not establish that a modeled task is widely used at work, that it occurs in every job carrying that occupational label, or that the interaction completed a work task. ATLAS use can therefore be visible even where a model suggests limited task applicability: users may test a product, use it for a small component, or bring it to activity whose surrounding job context is not represented by the task label.
Several steps separate a model’s task potential from an interaction appearing in ATLAS. A worker needs access to a suitable tool; awareness that it might help; permission under employer rules when the activity involves work information; and a workflow in which the tool’s output fits the task. These conditions can fail independently. An employee may lack a license, not know the feature exists, be prohibited from entering sensitive material, or find that checking and transferring the output takes longer than doing the task directly. A model may still assign exposure because its question concerns applicability, not whether these local conditions have been met. These are plausible mechanisms implied by the measures’ different units, not causes established by either source for a particular occupation or interaction pattern.
The reverse mismatch also has multiple explanations. ATLAS may record an interaction because a person explores a tool, drafts a personal query, or uses AI for a narrow work-related step; that observation does not prove the corresponding occupation has broadly adopted the technology. The ILO assessment may not assign that specific activity the same importance, or a classification may group it within a larger bundle of tasks. In addition, ATLAS’s product frame cannot capture activity in systems outside its stated coverage. A lack of recorded interactions can thus reflect where the data were collected, while a positive modeled signal can reflect potential that has not yet translated into observable use. Neither absence nor presence resolves the other measure’s question.
These signals are imperfect in different ways, but each can help frame an inquiry. The ILO model can identify tasks worth examining before adoption is widespread; ATLAS can show where interactions are visible in its product data. Neither is a ground truth for future capability, and neither is a probability that a person will lose a job. For a worker, the practical comparison is narrower: does a modeled task resemble work actually performed, and is there evidence that a tool is being used in the relevant workflow? Those answers require local task and implementation information. A gap between the measures marks uncertainty about the path from potential to use; it does not, on its own, establish either safety or displacement.
Sources: Generative AI and Jobs: A Refined Global Index of Occupational Exposure
Why can exposure signals coexist with different employment outlooks?
The U.S. Bureau of Labor Statistics (BLS) combines occupational exposure measures to describe how AI-related signals map to occupations; its categories do not say what will happen to employment. BLS’s “Artificial Intelligence (AI) exposure categories” page explains a four-category approach that brings together external, theory-based exposure measures and observed interaction evidence mapped to occupations. This combination offers more than either input alone: it places modeled applicability alongside evidence of recorded activity. But the resulting category remains a description of exposure at the occupational level, not a forecast of hiring, layoffs, hours, or an individual worker’s prospects.
The combination matters because modeled potential and recorded interaction each leave a different gap. A theoretical measure can identify task applicability without showing that workers are using a tool; interaction evidence can reveal activity without showing how much of an occupation’s work it changes. Mapping both to occupations creates a shared frame for comparison. In BLS’s framework, the categories organize this combined information into four levels rather than treating one signal as a complete account. That is a useful descriptive step: a reader can see how an occupational grouping is characterized across multiple inputs, rather than mistaking a single capability score or a product-use record for a complete measure of work change.
The label “exposure category” needs to stay attached to that construction. It names the category assigned through BLS’s occupational framework; it does not mean a worker has personally received an AI tool, uses it routinely, or has had duties removed. BLS explicitly distinguishes the categories from employment effects and direct worker use. A category is not an observed transition in a workplace. It does not record whether an employer has approved a system, whether the output meets the relevant quality standard, or whether a manager changed staffing after a workflow change. Those are separate facts that require evidence at the level where the decision or outcome occurred.
The occupational unit also compresses substantial variation. A job title can cover workers whose task shares differ by employer, industry, seniority, team design, and local rules. One person may spend much of the week producing a first draft; another may spend more time reconciling inconsistent records, handling exceptions, or explaining a result to a client. A category attached to their shared occupational grouping cannot specify those differences. This is reasoning from the measure’s unit, not a BLS empirical finding about any particular occupation: when a summary is assigned to a group, it cannot resolve every member’s task bundle without finer-grained information.
Even within the same organization, task mix and exposure can vary. Two employees with the same title may use the same software but face different inputs, review burdens, or consequences if an error passes through. A repeatable task with stable digital inputs may be easier to test with a tool than an exception-heavy task requiring case judgment. Accountability can also change the workflow: a draft may be quick to generate, while deciding whether it is accurate enough to send remains a human responsibility. The category does not describe those workflow details, so it cannot tell an individual which activities are practically affected or how much time their review requires.
The category also leaves the direction and scale of change open. Even if a task is exposed and a tool is used, an employer could reorganize duties, expand output, improve response times, shift review responsibilities, or reduce some labor demand. Which result occurs depends on adoption choices and broader conditions the category does not measure. BLS’s own outcome boundary matters here: the exposure classification does not establish that any one of these consequences has occurred. Treating a higher category as an employment forecast would turn an input about occupational exposure into an outcome measure the framework says it is not.
Combining multiple signals is still a useful improvement over relying only on a capability estimate. It can reveal a more informative occupational pattern while retaining the limits of its component measures and mapping. The practical reading is to use the BLS category as a prompt for a more specific question: which tasks in this version of the occupation are relevant, and what evidence exists about their use and redesign in the setting that matters? The category can orient that investigation, but the individual task bundle and employment outcome remain unresolved until separately observed.
Sources: Artificial Intelligence (AI) exposure categories
What do employment projections add?
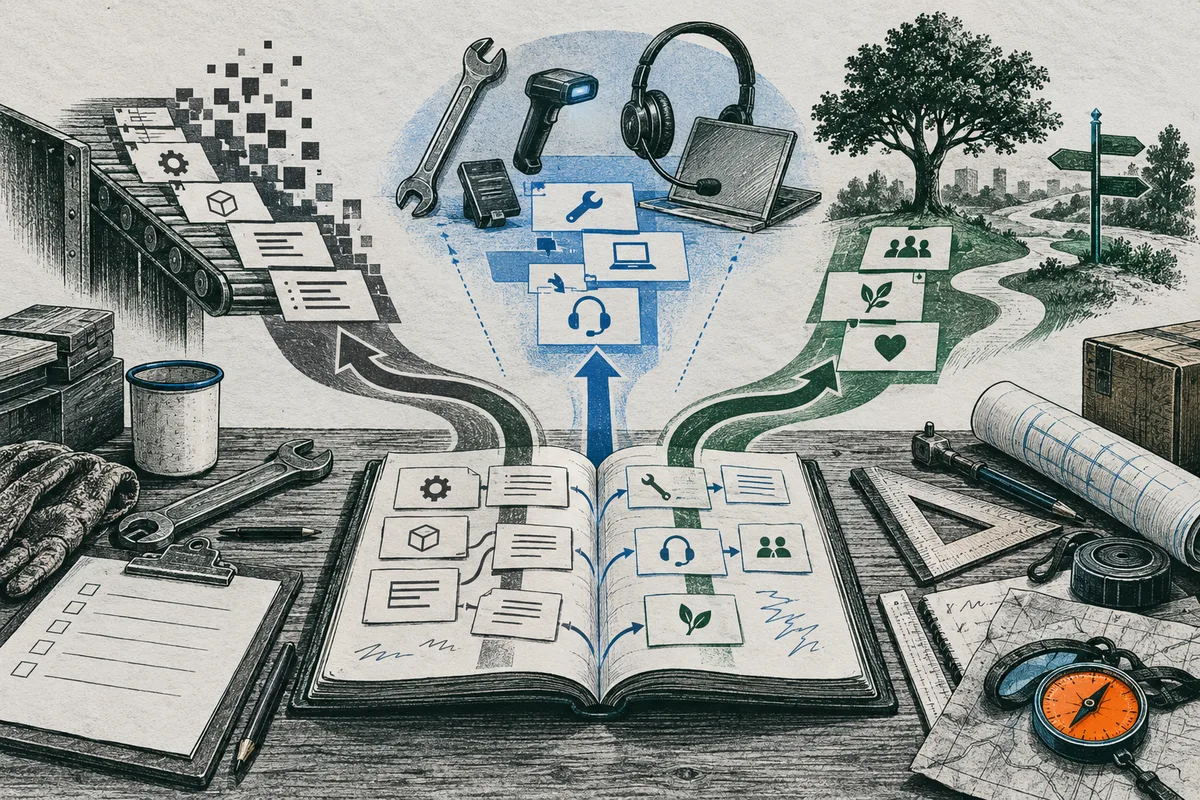
Use an occupational outlook beside AI exposure evidence as a broad demand baseline, not as a verdict about what AI will do to a particular worker’s job. The U.S. Bureau of Labor Statistics (BLS), in “Artificial Intelligence (AI) impacts on employment projections,” says its Employment Projections program prepares annual projections ten years ahead across about 800 detailed occupations and 300 industries. It studies factors expected to affect employment, including emerging technologies, but the result remains conditional on stated assumptions. The projection answers how employment might develop under a modeled set of long-term economic conditions; an exposure measure asks whether tasks appear susceptible to AI-related change. Neither substitutes for the other.
BLS builds projections from historical data and relationships through a base year, then considers likely developments that may alter those patterns. The program focuses on structural trends and does not try to predict the next business-cycle movement. Its assumptions cover the labor force, macroeconomy, industry employment, and occupational employment. BLS also assumes productivity and technological progress will broadly follow historical experience. It researches technologies and other factors that historical data may not capture, but says it generally makes adjustments conservatively where evidence for change is convincing. These choices make projections comparable across occupations, while also defining their limits: they are not a promise about the future, and actual employment can differ when assumptions do not hold.
That treatment matters for AI because capability and adoption can move faster than the historical relationships used to project employment. BLS describes uncertainty about emerging technology’s effects as high and updates projections annually as new data and research become available. Its method recognizes technology as one influence among many, rather than assigning every projected occupational change to a new tool. A projection can therefore incorporate a considered judgment about AI without isolating AI’s contribution. It is a structured baseline for broad demand, not a causal estimate of how many jobs a technology created or removed.
The BLS article “Artificial intelligence, information technology, and employment, 2024–34” illustrates the distinction using U.S. projections for 2024 to 2034. It projects data scientist employment to rise 33.5 percent, an increase of 82,500 jobs, and software developer employment to rise 15.8 percent, or 267,700 jobs. In the same period, customer service representative employment is projected to fall 5.5 percent, or 153,700 jobs; procurement clerks, 8.7 percent, or 5,400 jobs. These are projected changes in occupational employment, not measured outcomes after a controlled comparison of AI adopters and non-adopters. BLS says AI adoption and productivity gains are expected to contribute to demand patterns, while the broader projection method considers many influences.
The comparison is informative precisely because it does not reduce exposure to a single direction of employment change. A role can contain tasks that AI systems may assist or automate while total employment is projected to grow. Growth could accompany new demand, expanded output, complementary work, or changed task allocation; the occupational projection by itself does not identify which mechanism dominates. Workers in a growing occupation may still face altered duties, different entry-level tasks, or new review responsibilities. Aggregate growth is not evidence that each existing position is unchanged, nor does it mean every worker shares equally in the projected demand.
The reverse also requires care. A projected decline in an occupation does not establish that AI caused it. Demand shifts, investment, industry structure, demographic patterns, organizational choices, and other technologies can affect occupational totals. The BLS IT article connects AI with some expected productivity and demand effects, but the listed changes are not an AI-only accounting. Even when BLS explicitly mentions AI, the projection does not separate its contribution from other forces or show what would have happened without adoption. A projected decline can coexist with AI-related task redesign and with non-AI causes; the table cannot apportion responsibility among them.
For a worker, the practical use is to read the two signals on separate lines. Exposure evidence can help identify tasks for closer inspection; an occupational projection can provide a U.S. national baseline for the broad direction of employment demand over a stated decade. The 2024–34 figures should not be treated as forecasts for another country, a local labor market, one employer, or an individual position. Nor should a projected increase reassure someone that their particular task mix will remain stable. Projections remain useful despite uncertainty: they provide a common, periodically revised reference for comparing broad demand context. Their proper role is orientation. To explain a local staffing decision or attribute it to AI requires evidence tied to the deployment and workplace, which an occupational outlook does not supply.
Sources: Artificial Intelligence (AI) impacts on employment projections; Artificial intelligence, information technology, and employment, 2024–34
What evidence would actually support a displacement claim?
To support the claim that an AI deployment displaced workers, evidence would need to connect a defined implementation to recurring changes in work, then connect those changes to a measured employment outcome while testing what else could explain it. A tool’s presence, a high exposure signal, or a layoff announced after an AI launch does not complete that chain. This section’s evidence ladder is a reasoning framework derived from the differences among technology, workflow, and labor measures; it is not a standardized or validated instrument. It asks whether the proposed cause, intermediate change, outcome, timing, and comparison can all be documented in a bounded workplace and period.
First define the deployment precisely enough that another observer could tell what changed. Identify the tool or system, when it entered use, which unit or locations were covered, which workflow it was intended to affect, who could use it, and whether the change was a test, limited rollout, or operating system. Include the relevant version or configuration if it changed during the observation period. A general statement that a company “adopted AI” is too broad: distinct teams may use different tools for unrelated tasks, and a procurement announcement may precede actual access by months. The scope determines which workers and activities could plausibly be affected and prevents a company-wide label from standing in for evidence about a particular process.
Second establish use in that process, not merely availability. Useful records could include dated system logs linked to the workflow, work instructions, assigned cases, or operational records showing how often the tool was used and by whom in the defined period. The evidence should distinguish routine production use from demonstrations, optional experimentation, or a pilot whose outputs were not acted on. Where records identify only interactions, they still may not show that an output entered completed work. The aim is to establish that deployment reached the relevant recurring activity at meaningful scope, without treating account licenses, training attendance, access permissions, or a vendor announcement as proof of work completed through the system.
Third document what changed in the work itself. Compare task allocation before and after implementation: which activities workers performed, which the system performed, and which remained for review, correction, exception handling, or approval? Changes in task time, case volume, output, error correction, handoffs, and review hours can help show whether work was removed, compressed, expanded, or shifted to another role. These measures need consistent definitions. For instance, fewer minutes spent drafting does not necessarily mean fewer labor hours if people now handle more cases, verify outputs, or resolve exceptions. A change in task mix is evidence of redesign; it does not yet establish a reduction in employment.
Fourth specify the employment outcome rather than using the loose word “jobs.” Relevant measures might include headcount in the affected unit, paid hours, vacancies or replacement hiring, separations, contractors, or staffing per comparable unit of output. Each captures a different margin. Stable headcount can conceal fewer hours or unfilled vacancies; lower headcount can follow attrition without layoffs; stable employment alongside sharply higher output may still mean labor required per task changed. Set a baseline before deployment and a follow-up period after it, then identify the population counted and any transfers between teams. Timing should fit the proposed mechanism: if staff reductions preceded operational use, the deployment cannot explain those earlier changes.
Fifth ask what would plausibly have happened without the deployment. A simple before-and-after comparison can reveal a sequence, but other changes occurring at the same time may account for the result. A stronger comparison might use a similar team, site, or workflow not yet using the tool, provided it had a credible prior trend and comparable demand. Alternatively, a longer time series can show whether employment or hours shifted beyond an existing trajectory. These comparisons are imperfect when groups differ or other interventions overlap, so the analysis should state the limits rather than claim laboratory certainty. The key is to test an explicit counterfactual: whether a similar staffing change appears in a credible comparison absent the deployment.
The alternative explanations should be checked directly. Did customer demand rise or fall? Did the organization change its budget, outsource work, merge teams, relocate activity, alter service targets, or reorganize for reasons unrelated to the tool? Were departures voluntary, and were roles left vacant through attrition? Did another software or process change occur at the same time? Evidence such as budget records, service volume, outsourcing contracts, hiring plans, organizational charts, and departure timing can refine the account. These factors do not automatically disprove an AI contribution; they matter because several forces can operate together. The case may support a partial contribution rather than a claim that AI alone caused every staffing change.
Consider a deliberately hypothetical support center. Suppose a company reports that it launched an assistant and later reduced the number of agents. The sequence is a reason to investigate, not yet proof. A stronger account would define which center and queues received the tool; establish that agents used its suggested replies in customer cases; document whether drafting, review, escalation, or cases handled per hour changed; and compare dated headcount, paid hours, vacancies, and separations against the center’s pre-launch baseline. It would then examine call volume, budget reductions, outsourcing, attrition, and any comparison with a similar queue. No outcome is asserted here: the illustration shows what records would make the causal claim more or less credible.
Local evidence of layoffs after deployment deserves serious attention even if national projections show growth in related occupations. A national projection and a local sequence refer to different populations and answer different questions; one does not cancel the other. The counterfactual test is meant to sharpen the local signal by asking which workers and tasks were affected, whether staffing changed after actual use, and whether the pattern differs from a plausible alternative. If internal records are incomplete, the careful conclusion may be that a deployment and layoffs coincided, while the mechanism or contribution remains unresolved. That is more informative than either dismissing workers’ direct evidence or converting timing alone into certainty.
Even a well-supported local case applies to its defined workflow, organization, population, and period; it does not establish an effect for every employer or the occupation nationally. Replication across settings is needed to judge prevalence, since implementations differ in task design, demand, review, and labor practices. Match the conclusion to the evidence: a documented contribution in one setting is meaningful but is not a general displacement rate. Exposure classifications and projections frame the question; a bounded causal account requires linked implementation, workflow, outcome, and comparison evidence.
Sources: Artificial Intelligence (AI) impacts on employment projections
How should an individual worker use the view without overreading it?
Use an aggregate chart as a prompt to inspect one recurring task in your own week, not as a description of your personal exposure or a forecast about your position. Choose a task with a recognizable beginning and end, then write down how often it occurs, what inputs it uses, what output is expected, and what happens when the usual case breaks. Add who reviews the result, how long review and correction take, who is accountable for errors, and whether your organization has approved any relevant tool. These details make the question concrete enough to discuss without pretending that an occupational label contains them.
For example, consider an illustrative document-summary workflow; this is not an employer case or evidence about actual adoption. A recurring assignment might begin with several digital documents and end with a short brief. The visible output is compact, but the work may include locating the current versions, reconciling conflicting dates or figures, checking each statement against its source, and deciding which exception changes the meaning. Record the frequency of the assignment and whether inputs are consistent. Separate the first-pass summary from source verification and exception judgment, because a tool that can draft the former may not resolve the latter. Note which review steps are required before the brief can be relied on and the time they actually take, rather than assuming that generated text is finished work.
The same audit should capture context a chart cannot supply: whether documents contain sensitive or restricted information, whether the approved system can accept them, what format the deliverable must follow, and who signs off. If no approved tool is available, do not treat public access to a similar product as permission to use it at work. If use is approved, distinguish an occasional personal experiment from a task assigned through an established workflow. Record the limits of what you can observe; a worker may not know the budget, procurement plan, or management intent, and should not be expected to infer confidential decisions from a task pattern.
The useful result is a more specific account of where change could matter. Stable, repeated inputs and a predictable first draft may be sensible areas to ask about or evaluate under the organization’s rules. Reconciliation, verification, exception handling, review time, and accountability identify work that remains in the workflow or may need a different design. That is an inspection of task composition, not proof that any part has been automated in routine practice. It also does not tell you whether output demand, staffing, or job design will change. Use the notes to frame a focused question about the workflow or training you need; treat them as a practical map of your work, not as evidence of a staffing decision.
Keep the record bounded to the chosen task. Note whether inputs use a standard template or vary by client, source, language, or urgency; whether missing information changes the answer; and whether corrections happen before anyone acts. These details distinguish a repeatable first pass from the surrounding work that makes an output usable; they are not scores to combine into a personal risk number. Mark unobserved steps as unknown and ask a process owner what the approved workflow requires. A short list of known steps, uncertainties, and approval questions is more useful than guessing how much of a role a chart category represents.
A useful note can also distinguish task frequency from task importance: a rare exception may carry greater consequences than a common routine case. Record that difference without implying the rare case determines the whole role. This keeps the audit attentive to the quality threshold and consequence of the deliverable, as well as its volume.
When does individual use become evidence of workplace adoption?
Individual use becomes evidence of workplace adoption only when the accessible record shows that an organization has incorporated a tool into a defined, recurring workflow. A useful practical distinction has three stages: experimentation, a controlled pilot, and routine integration. This is an analytical aid for describing implementation, not a universal or mandated maturity model. The labels matter less than the underlying records: what work is in scope, who is expected to use the system, how its inputs and outputs connect to the process, what review or governance applies, and who is responsible for operating it.
Experimentation may be a worker trying a permitted tool on a limited task, a demonstration, or voluntary exploration without an assigned production process. Evidence at this stage might establish that a person accessed a tool or tested a use case. It does not establish that coworkers were directed to use it, that outputs entered completed work, or that the organization changed its process. Access records and a worker’s account can describe the experiment, but their reach should not be generalized to a team or occupation without evidence of that broader scope.
A controlled pilot has a stated boundary and an organized test: for example, a specified team, workflow, period, or set of cases, with someone responsible for the trial and a defined way to review outputs. A pilot record could include instructions, eligible users or cases, review requirements, and a decision process for continuing or stopping the test. Such records support the conclusion that an organization is evaluating use in that bounded setting. They do not show that use is widespread, permanent, or effective; a trial may remain optional, be paused, or end without becoming part of ordinary operations.
Routine integration requires evidence that use has become part of assigned work on an ongoing basis. Relevant records could include current procedures linking the tool to a recurring process, defined access and input/output connections, operating ownership, review and escalation rules, and operational documentation showing continued use within the stated scope. No single record necessarily establishes the whole picture: a procedure may describe an intended process, while usage records may show whether it is followed. Together, records should support the specific claim being made about where, by whom, and for what recurring work the system is used.
A license, training session, permissive policy, purchase announcement, or product launch can show availability, preparation, or intent. None alone demonstrates that a recurring assigned workflow now depends on the tool. The reverse limit matters too: a lack of public information does not prove an organization has not adopted a system, because internal procedures and plans may be confidential. The careful conclusion is therefore about what the available record supports. Even well-documented routine integration establishes an implementation fact; by itself, it does not establish a change in headcount, hours, vacancies, or employment.
Scope should remain explicit when describing any stage. A test involving internal drafts does not establish use for external advice, and a process used in one unit does not establish organization-wide practice. Dates help distinguish a current operating procedure from a proposal or an expired trial; named owners clarify whether responsibility sits with a team, a vendor, or no one yet. This makes a statement such as “the tool is in use” more precise and easier to verify.
What is the proportionate next step?
Treat a suggestive pattern as a reason to check one recurring task, not to make an immediate career change. For the next few times you do it, note its inputs, the first-pass output, exceptions, review or correction time, and whether an approved tool is actually part of the workflow. This small record can clarify what might be upgraded—for example, learning to use an authorized tool on a repeatable first pass—or whether the task still depends mainly on judgment, coordination, or accountability. If the work and local process show no material change, monitor the task and revisit it when responsibilities or tools change. If change is visible and affects your role, compare adjacent or larger moves before committing. Filter any option through your salary floor, location, training time, health, and family responsibilities; a technically plausible path may not be workable for you now.
The free task checker at /ai-job-risk-checker can help organize task-level change-pressure signals and first actions. It does not produce a validated probability that you will be displaced. If you still face a consequential choice between realistic paths, the paid career roadmap compares scenarios around your preferences and constraints and can structure a 30/60/90-day plan; it does not guarantee employment or income. No single task check removes uncertainty. Its value is to make the next decision smaller and more grounded before you spend money, time, or experience on a transition.
Questions readers ask
Can Google’s September 2026 ATLAS explorer show which jobs AI has displaced?
No. Google’s September release adds an explorer for patterns in interactions with covered products. It does not link employer deployments to staffing or employment outcomes.
What does the separate scientist study establish?
Google’s AI in Science report describes survey and interaction findings about science workflows, including reported time savings and verification work. Its survey covered 637 U.S. and U.K. scientists through an online panel; it is not a representative workforce study.
Sources and notes
- New insights from Google’s AI & Economy ATLAS
Dates the September 15, 2026 release; describes the interactive open-access experience and reports country/occupation examples plus headline findings from the separate scientist study.
- Understanding the AI economy
Defines ATLAS v1.0’s covered products and interaction corpus, reported coverage, task-use findings, and acknowledged excluded products and enterprise activity.
- AI in Science: Early Insights
Reports the scientist study’s separate survey and model-analysis methods, reported time savings, validation work, backlog, and workflow bottlenecks.
- AI in Science: Early Insights
Records MIT FutureTech’s collaboration and outlines the study’s workflow interpretation, including verification demand and downstream bottlenecks.
- Generative AI and Jobs: A Refined Global Index of Occupational Exposure
Describes a task-level global exposure index combining task data, expert assessment, and AI predictions across nearly 30,000 tasks, with occupational exposure gradients.
- Artificial Intelligence (AI) exposure categories
Explains BLS’s four occupational categories combining external theoretical exposure and mapped observed-interaction measures, and says the categories do not measure employment effects or direct worker use.
- Artificial Intelligence (AI) impacts on employment projections
Explains how BLS handles AI within annual ten-year occupational projections, including structural-trend assumptions and uncertainty about technology’s effects.
- Artificial intelligence, information technology, and employment, 2024–34
Reports U.S. 2024–34 IT employment projections and notes AI is one influence among demand, investment, and other factors.
Apply this to your own work
See the whole job market at once.
Explore which occupations AI may reshape, then turn the signal into a practical response.
Explore the job map