
METR’s 50% time horizon estimates the human-expert duration of benchmark tasks at which an evaluated AI setup is predicted to complete half of them successfully. It is a capability summary for that task suite and setup, not the agent’s runtime, a measure of workplace productivity, or a job-loss probability. Interpret it alongside the tasks, human-time estimates, scoring rule, evaluation version and uncertainty. To assess a work task, compare its conditions and acceptance standard with the benchmark, then seek local workflow evidence.
What does METR mean by a task-completion time horizon?
METR’s time horizon is the human-expert duration associated with benchmark tasks at which an evaluated agent is predicted to complete 50% of them. In plain terms, it asks: for tasks that experts take about this long, what duration marks the point where the agent succeeds on half of the defined suite? The unit is human task time, not elapsed time spent by the AI. METR’s dashboard explicitly says the horizon does not mean the agent can operate unattended for that many minutes or hours. [Task-Completion Time Horizons of Frontier AI Models](https://metr.org/time-horizons/)
The word “horizon” can sound like a runtime limit, but here it names a location on a task-duration scale: the estimated duration of human work associated with a selected completion threshold. The threshold is a summary across the benchmark tasks and the stated evaluation, not a claim that every task at that duration has the same outcome. The relevant duration and threshold are conditional on which tasks, agent, and evaluation setup are used. METR’s dashboard gives a shared way to describe performance against task difficulty; it does not report an autonomous session clock. [Task-Completion Time Horizons of Frontier AI Models](https://metr.org/time-horizons/)
For example, if a dashboard reports a horizon measured in hours, those hours refer to the experts’ task duration on the evaluated suite at the stated completion threshold. They are not a promise that an agent can sustain an independent work session for the same span, nor a measure of how long a person would need to supervise or repair the output. Those are different quantities. The horizon compresses performance into one threshold tied to human task duration; details about how those durations were established belong to the measurement procedure, while the definition itself stays narrow. Read the number with its named benchmark and setup, rather than treating it as a general clock for AI work. [Task-Completion Time Horizons of Frontier AI Models](https://metr.org/time-horizons/)
Sources: Task-Completion Time Horizons of Frontier AI Models
How does human task time become the scale?
The human-time label is a calibration attached to benchmark tasks, not an intrinsic property of a task or a conversion from software work into ordinary job hours. In *Measuring AI Ability to Complete Long Software Tasks*, the METR researchers describe measuring how long relevant human experts took on tasks and using those durations to organize the benchmark. The study combined RE-Bench, HCAST, and 66 novel, shorter tasks; the human timing helped place unlike tasks on an interpretable scale before comparing agent performance across them. [Measuring AI Ability to Complete Long Software Tasks](https://proceedings.neurips.cc/paper_files/paper/2025/file/85069585133c4c168c865e65d72e9775-Paper-Conference.pdf)
That calibration answers a practical measurement problem. A raw score says how an agent performed under an evaluation, but it does not by itself indicate whether the tested items resemble short exercises or extended work. Attaching expert duration gives the score a human-scale coordinate: tasks can be grouped by the time relevant experts needed, and results can be discussed across duration bands. It makes a comparison easier to interpret; it does not make different tasks identical. The duration remains tied to the task as scoped and presented in the study, including its instructions, available materials, environment, and stopping condition. [Measuring AI Ability to Complete Long Software Tasks](https://proceedings.neurips.cc/paper_files/paper/2025/file/85069585133c4c168c865e65d72e9775-Paper-Conference.pdf)
The identity and experience of the human doing a task matter to that coordinate. An expert familiar with a repository or research problem may finish more quickly than a capable person encountering it for the first time; a different specialist may use a different method or decide that more checking is needed. The label therefore means the time associated with the study’s relevant expert timing procedure, not a universal estimate of how long any worker would take. It is best read as a benchmark calibration with a stated reference population, rather than a stopwatch prediction for an individual.
Task boundaries matter as well. A bounded benchmark item can specify a starting state and an endpoint, while real work may include locating the problem, clarifying requirements, coordinating with others, waiting for access, or deciding whether the result is acceptable. If those activities are outside the timed item, they are also outside its human-duration label. The study’s measured duration can still support comparisons within its evaluation: consistent task definitions and timing provide a common reference even when the tasks differ in subject matter. But a duration should not silently absorb surrounding work that the benchmark did not time. [Measuring AI Ability to Complete Long Software Tasks](https://proceedings.neurips.cc/paper_files/paper/2025/file/85069585133c4c168c865e65d72e9775-Paper-Conference.pdf)
Timing is also an estimate produced under a protocol, not a perfectly exact constant. Work can be interrupted, participants can vary in familiarity, and judgments about when a task is complete can affect recorded duration. Those sources of variation make close distinctions in human-time labels less certain and constrain how literally a duration should be transferred to another task or person. They do not change what the label is intended to represent: expert time attached to the benchmark item under the study’s procedure. The useful reading is a calibrated scale whose precision depends on its timing and task definitions, not a direct equivalence between benchmark minutes and a worker’s scheduled hours. [Measuring AI Ability to Complete Long Software Tasks](https://proceedings.neurips.cc/paper_files/paper/2025/file/85069585133c4c168c865e65d72e9775-Paper-Conference.pdf)
The scale is consequently comparative rather than normative. If two benchmark items have different subject matter but both carry expert-time labels, an analysis can ask how performance changes as the labeled duration increases. That does not establish that the items require the same skills, have equal consequences, or would occupy the same place in a workplace. It supplies a common axis for asking a narrower question about completion across the tasks included. The original paper’s reported material matters here: its calibration and evaluations concern the assembled software and machine-learning research benchmarks, not a representative sample of every kind of professional assignment. [Measuring AI Ability to Complete Long Software Tasks](https://proceedings.neurips.cc/paper_files/paper/2025/file/85069585133c4c168c865e65d72e9775-Paper-Conference.pdf)
This is why the label should travel with its benchmark description whenever results are compared or quoted, including the timing reference and task boundary.
Sources: Measuring AI Ability to Complete Long Software Tasks
What work is inside the evaluated task suite?
The estimate is built from a deliberately bounded collection of software tasks, not a sample of software occupations. METR’s dashboard, *Task-Completion Time Horizons of Frontier AI Models*, says the current suite draws from RE-Bench, HCAST, and shorter novel software tasks. It characterizes the primary task families as software engineering, machine learning, and cybersecurity. The dashboard calls the tasks self-contained and well-specified, with clear success criteria that can be evaluated automatically. Those properties define what counts as an item for this measurement: a task has a starting prompt and environment, an intended result, and an evaluation rule. The suite asks how agents perform on those constructed items as their human-expert duration changes. It does not attempt to inventory every activity that happens to sit inside a developer’s or researcher’s job title. [Task-Completion Time Horizons of Frontier AI Models](https://metr.org/time-horizons/)
The boundaries are consequential. METR describes giving people and agents generally the same instructions and affordances, so the comparison starts from an arranged task environment rather than from an unprepared worker’s ordinary workday. For many tasks, a capable agent is placed in the task environment and allowed to work across multiple steps subject to a token and time limit. The dashboard’s FAQ says an evaluation pairs a model with a scaffold that supplies tools and manages the interaction loop; the chosen scaffold can include a coding agent setup, and METR first uses a development set to select an appropriate arrangement before running a separate, larger test set. The result therefore belongs to a specified model, task set, and agent/tool arrangement. A scaffold is part of the measurement conditions, not a hidden claim that the model alone performs without tools or orchestration. [Task-Completion Time Horizons of Frontier AI Models](https://metr.org/time-horizons/)
The *Measuring AI Ability to Complete Long Software Tasks* study gives the suite’s earlier composition in more detail: it combined RE-Bench, HCAST, and 66 novel shorter tasks. The current dashboard describes a larger, updated collection, so those exact counts should be attached to the paper’s version rather than silently assigned to every later chart. Across either description, the common design is a collection of bounded software or related technical tasks with defined evaluation conditions. A test might ask an agent to make a change in a supplied software environment and then check whether the requested condition is met. That design can compare task outcomes consistently across models or durations; it does not make the supplied environment equivalent to the full information and responsibilities surrounding a production change. [Measuring AI Ability to Complete Long Software Tasks](https://proceedings.neurips.cc/paper_files/paper/2025/file/85069585133c4c168c865e65d72e9775-Paper-Conference.pdf)
Human-duration labels also reflect the bounded setup. The dashboard says most estimates come from contractors attempting tasks with the same instructions and affordances as agents, and it uses the geometric mean of successful human completion times. It notes that these participants and agents have less context than professionals who already know a project. For some items, METR instead relies on expert estimates or times from quality-assurance tests because it lacks reliable human completion times. Consequently, “a task that experts take two hours” means a task duration calibrated under the described task and timing procedure. It does not include every preceding meeting, access request, discovery step, or downstream review unless that activity is itself part of the item and its endpoint. The dashboard explicitly contrasts its specified tasks with day-to-day work that draws on prior conversations, tacit knowledge, and codebase familiarity. [Task-Completion Time Horizons of Frontier AI Models](https://metr.org/time-horizons/)
Consider an illustrative contrast, not a reported METR observation. An isolated repository task might provide a bug description, a working copy, tools, and a test that defines the requested fix. A comparable change at work could also depend on why the bug matters, which customer commitments take priority, whether the relevant logs are accessible, how a legacy integration behaves, who must approve a change, and whether an apparently passing fix is safe to release. Some of those duties could be added to a benchmark item, but they are not automatically represented just because the item concerns software. The difference is about the task boundary and context provided, not about whether the benchmark task is technically meaningful.
That boundary makes the benchmark useful for a narrower question: how reliably a specified agent completes selected, evaluable technical tasks as their calibrated duration increases. It can measure that capability well while leaving out responsibilities that require missing context, coordination, prioritization, or an acceptance standard not encoded in the task. The dashboard itself says its distribution is primarily software engineering, machine learning, and cybersecurity, and warns that tasks are cleaner than much economically valuable labor. The study and dashboard thus provide evidence about the constructed suite. They do not turn it into a complete account of a job, much less an occupation-wide measure. Broader claims require evidence about the additional work and conditions they name; the benchmark need not cover an entire job to provide a useful measurement of the tasks it does test. [Measuring AI Ability to Complete Long Software Tasks](https://proceedings.neurips.cc/paper_files/paper/2025/file/85069585133c4c168c865e65d72e9775-Paper-Conference.pdf)
Sources: Task-Completion Time Horizons of Frontier AI Models; Measuring AI Ability to Complete Long Software Tasks
How are success and human duration turned into a horizon?
The calculation connects an outcome for each agent attempt to a human-duration label for its task, then estimates how the chance of success changes across those labels. METR’s dashboard describes the headline 50% horizon as the duration where a fitted curve reaches 50% success probability; it also offers an 80% threshold. The important sequence is task by task: establish the task’s human-time coordinate, run the agent in the specified setup, record how the attempt scored, aggregate evidence across tasks and runs, estimate the success-versus-duration relationship, and read the duration where that relationship reaches the chosen level. A horizon is therefore a coordinate derived from a performance curve, not simply the duration of one specially selected item. [Task-Completion Time Horizons of Frontier AI Models](https://metr.org/time-horizons/)
The public METR analysis repository documents the processing in terms of known human completion times, recorded agent successes and failures, logistic fitting against log2 human minutes, and extraction of the duration at a selected success threshold. Its data description includes task identifiers and families, model aliases, binary scores coded as failure or success, continuous scores, human minutes, and task weights. This distinguishes raw attempt records from the headline estimate. A binary score makes the event used for a success-rate calculation explicit; a continuous score preserves graded information where a task’s scoring supplies it. The reported time horizon then depends on the operational score and analysis being used, rather than an informal judgment of how impressive an output looks. [METR eval-analysis-public](https://github.com/METR/eval-analysis-public)
The dashboard summarizes the fitted relationship as logistic. In broad terms, the analysis estimates a curve whose success probability varies with the logarithm of task duration, then solves for the duration at a selected probability such as one half. This is a model-based summary of many task observations: the threshold is the curve’s crossing point, not a separately observed outcome at every possible number of minutes. The repository describes logistic regression and the reported p50 and p80 horizons in its pipeline documentation. This makes the central statistic interpretable as a common comparison point, while leaving the curve and the observations from which it was estimated as the fuller account of measured performance. [METR eval-analysis-public](https://github.com/METR/eval-analysis-public)
A schematic illustration may help without inventing a score. Imagine placing each task along a horizontal axis according to its human-minute label and marking the evaluated agent’s attempts as successes or failures. Shorter-duration tasks and longer-duration tasks contribute evidence at different positions; repeated attempts can show whether an item is passed consistently or variably. The analysis combines those marks, with the task weighting and fitting choices documented for the relevant report, to estimate a rising or otherwise shaped success relationship. One can then ask where the estimated curve crosses the selected success level. This illustration describes the logic of the procedure; it is not a METR model result or a claim that every item follows the curve smoothly.
The repository also documents bootstrap sampling for confidence intervals and logistic regression fits. In plain language, resampling provides a way to show how the estimate varies when the observed task evidence is perturbed through repeated samples under that procedure. A confidence interval, when reported, communicates uncertainty around an estimated quantity under the analysis assumptions; it is not a guarantee that the true horizon lies in a particular range, nor does it account automatically for every uncertainty in task selection or human timing. The dashboard’s plotted curve can be shown without bootstrapped confidence intervals, while report outputs may include interval columns for p50 or p80. Readers should therefore distinguish the point estimate from any uncertainty interval displayed for its particular analysis. [METR eval-analysis-public](https://github.com/METR/eval-analysis-public)
Aggregation matters because a headline probability does not mean every task at the crossing duration has that same observed success rate. The fitted estimate pools evidence over a distribution of tasks whose individual difficulty and outcomes vary. A threshold offers a concise answer to a defined summary question—at what human-duration coordinate does estimated success reach this level? It does not preserve every task identity, score, or repeated-run pattern. Those details remain in the underlying observations and are needed when the question shifts from an aggregate benchmark comparison to the performance of a specific task class. [Task-Completion Time Horizons of Frontier AI Models](https://metr.org/time-horizons/)
Finally, the calculation is attached to an evaluation version and setup. METR’s dashboard separates the current Time Horizon 1.1 measurements from original Time Horizon 1.0 computations and links its analysis code and raw data. The public repository likewise describes separate report pipelines. This matters methodologically because “the fitted horizon” names the output of a particular set of task records, scores, weights, and fitting procedures. For the narrow calculation described here, the supported claim is that task-level outcome data are related to human-minute labels, modeled across duration, and evaluated at a selected success threshold. Comparing the resulting coordinates is meaningful when the task suite and setup are identified alongside the estimate. [Task-Completion Time Horizons of Frontier AI Models](https://metr.org/time-horizons/)
The counterpoint is that a compact fitted threshold is useful precisely because it reduces a complex result to a comparable coordinate. But the reduction depends on which tasks were sampled, how their outcomes were coded or weighted, and how the success curve was estimated. The number alone is not the complete outcome distribution, and it is not a direct measurement made at every duration on the curve. The paper, dashboard, and public analysis code make the calculation legible enough to inspect; interpretation should keep the chosen threshold attached to those documented inputs and procedures. [METR eval-analysis-public](https://github.com/METR/eval-analysis-public)
Sources: Task-Completion Time Horizons of Frontier AI Models; METR eval-analysis-public
What does one threshold conceal about task-level outcomes?
No. METR’s *Task-Completion Time Horizons of Frontier AI Models* dashboard gives a concrete example: for GPT-5, whose horizon is about 2 hours 17 minutes, tasks with human-expert durations from 90 minutes to three hours divide into three approximate groups. The agent succeeds on every evaluated run for about one-third of those tasks, fails on every run for about one-third, and succeeds on some runs but not others for the remaining third. These are METR’s reported proportions for that model and band, not a general law about tasks near any model’s 50% horizon.
The example shows why the aggregate crossing does not describe an identical chance attached to each item. Tasks in one duration band can differ in subject, hidden difficulty, and how closely their demands fit the model’s strengths. A model may handle one task repeatedly while consistently missing another of similar human duration; a third can sit near the boundary of what it can do, so different runs produce different outcomes. When these item outcomes are combined into the curve, the resulting threshold summarizes performance across the band. The apparent tension disappears once the aggregate and the individual task are treated as different units of analysis.
METR’s three groups also distinguish two ideas often collapsed into “50% success.” The first is an average across a selected collection of tasks: roughly half of the task outcomes contribute successes at a given point in the fitted relationship. The second is repeatability on one task: whether repeated attempts at that item tend to reach the same result. An aggregate near one-half can arise from many mixtures of stable passes, stable failures, and variable items. It does not imply that each item has approximately one success in every two attempts, nor that any particular item will be dependable because its duration falls close to the crossing.
That distinction matters when the question concerns a specific kind of task or whether an agent can be relied on for it. The dashboard’s example supports a narrow conclusion: within this 90-minute-to-three-hour band, the tested GPT-5 outcomes were heterogeneous, including both repeatable and run-variable patterns. It does not reveal the likely outcome for a different codebase, task definition, model setup, or future run. To answer an item-level question, the relevant evidence would be repeated evaluations of comparable tasks under the setup of interest, rather than the aggregate horizon alone. “Consistently” here describes the observed pattern across the attempts in that evaluation, not certainty about every possible prompt, scaffold, or future version of the model. Likewise, “sometimes” identifies variation across runs on an item; it does not specify the cause of that variation or predict which attempt will succeed. The published proportions classify task outcomes, rather than assign calibrated odds to an individual worker’s task.
The threshold still earns its place as a common comparison coordinate: it condenses a broad task set into a consistent summary that can be compared across evaluated models. The compression becomes a limitation only when the reader asks what happens on a particular task type or how dependable an individual item is. METR’s own example makes that boundary visible without invalidating the aggregate: the horizon summarizes the distribution, while the distribution’s internal patterns answer questions about item-level predictability. For example, a band-level average can be pulled toward one-half by a mix of items that nearly always pass and items that nearly always fail, even if very few items individually behave like coin flips. A different mix could produce the same average while containing more run-variable items. METR’s grouping is useful precisely because it shows that these possibilities are not interchangeable: the headline alone cannot distinguish them, but its reported task-level example can.
Sources: Task-Completion Time Horizons of Frontier AI Models
What changed between Time Horizon versions?
METR’s *Time Horizon 1.1* update changes both the task suite and the evaluation infrastructure, so a chart value should be read with its version. The suite grew from 170 to 228 tasks: METR added 73 HCAST tasks, removed 15, and updated 53 existing tasks. Of those updates, 27 changed a task definition, 13 changed its human-time estimate, and 13 changed both. METR says removals and revisions generally addressed confusing descriptions, opportunities for reward hacking, or scoring errors. The number of tasks estimated to take people at least eight hours increased from 14 to 31, although only five of those 31 had human-baselined times in the new suite. The infrastructure also moved from METR’s Vivaria system to Inspect, an open-source evaluation framework. Since 53 tasks changed in some respect and 15 left the suite, the update is not simply a software wrapper change around identical benchmark items. The resulting task pool both broadens coverage at the long end and alters the set, definitions, or calibration to which performance is attached.
The larger suite was intended to improve coverage and tighten estimates, particularly toward the longer-task end. METR reports that the upper confidence bound for Claude Opus 4.5 was 4.4 times its point estimate under TH 1.0 and 2.3 times the point estimate under TH 1.1. It also notes that the intervals remain wide and that more long tasks are needed. This is a concrete reason a revised protocol can improve a measurement while changing it: more tasks and corrected definitions can make an estimate more informative, but a changed task distribution can also shift the quantity being estimated.
METR separately tested the infrastructure change on the same new TH 1.1 suite, running GPT-4o, Claude 3.7 Sonnet, and o3 under both Vivaria and Inspect. Under Vivaria, their estimated horizons were respectively 6 minutes (bootstrapped interval 3–12), 56 minutes (32–90), and 116 minutes (72–192). Under Inspect, the corresponding estimates were 5 minutes (3–10), 57 minutes (30–101), and 119 minutes (73–201). These close point estimates test whether swapping evaluation infrastructure produced a large horizon shift for these three models on this revised suite. For these cases, the reported comparison offers evidence against a large infrastructure effect on the horizon estimate.
That infrastructure comparison does not isolate old-suite versus new-suite differences: both sides use the new task suite, and the factor being compared is Vivaria versus Inspect. METR also reports that some individual model scores differed by infrastructure, including statistically higher scores for GPT-4o and o3 under Vivaria in its paired task-score comparison. Similar horizon estimates can therefore coexist with item-level score changes because the headline horizon aggregates outcomes over tasks. Nor does the three-model comparison establish that the infrastructure behaves equivalently for every model or evaluation condition.
Old-versus-new suite comparability is a separate question. METR says the TH 1.1 estimates for many re-evaluated models generally fall within their TH 1.0 confidence intervals, but attributes changes primarily to the revised task suite and run-to-run noise, with a smaller contribution from infrastructure. The update also shows that trend estimates can depend on the comparison window: since 2023, the reported doubling time is 131 days under TH 1.1 and 165 days under TH 1.0, with mostly overlapping but not identical model sets. METR cautions that the two full-period growth rates cannot be directly compared because pre-2023 models were not re-estimated under TH 1.1. These results show why an interval overlap or similar infrastructure result should not be mistaken for complete protocol invariance.
For a reader comparing points or trends, record whether the result is TH 1.0 or TH 1.1 and the measurement date, then compare values within a clearly identified protocol where possible. The public dashboard presents both the current TH 1.1 series and original TH 1.0 computations, so its history spans protocol eras. A version label preserves what a comparison means: same-new-suite Vivaria-versus-Inspect checks infrastructure sensitivity in the studied cases; old-versus-new estimates also reflect task selection, task revisions, human-time updates, and run variation. Revision may improve task quality, coverage, or tooling while still interrupting direct historical comparability. The interval labels matter too: METR says these estimates use bootstrapping over task families, tasks, and runs, and notes that such intervals overstate run-level variance. They express uncertainty under that resampling procedure, not a blanket allowance for every difference between protocols. A point falling within an older interval is therefore useful context, but it does not erase the changed suite or turn the two measurements into a controlled repeat of an identical evaluation.
Sources: Time Horizon 1.1
Does a software horizon transfer across domains?
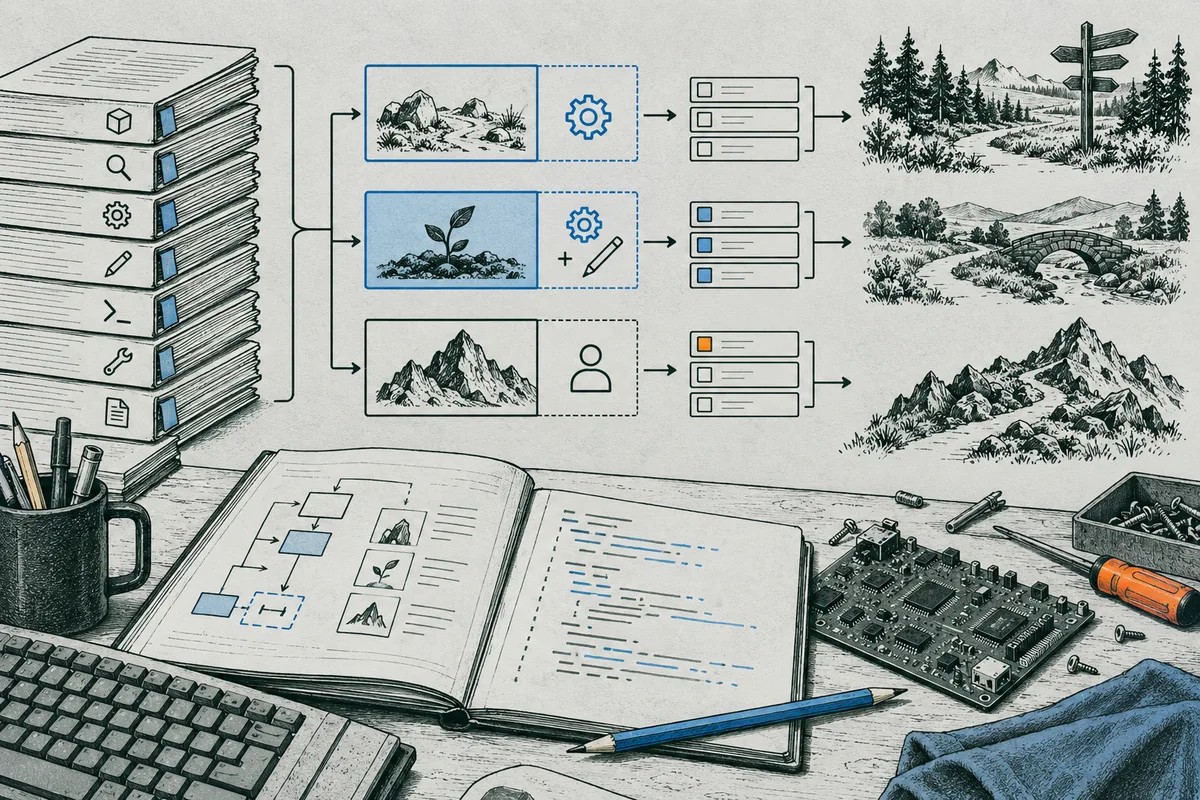
METR’s *How Does Time Horizon Vary Across Domains?* is a direct test of whether the horizon pattern seen on software-oriented evaluations appears similarly in other benchmark domains. It applies the time-horizon analysis to nine existing benchmark datasets rather than constructing a common new task suite. The post reports that estimates vary materially by domain. This supports a limited conclusion: the horizon can be investigated outside the original suite, but the resulting values depend on which domain benchmark and its measurement inputs are used. The nine-dataset exercise broadens the comparison beyond software while preserving the differences among the source datasets; it does not establish one transferable horizon for all work. [How Does Time Horizon Vary Across Domains?](https://metr.org/blog/2025-07-14-how-does-time-horizon-vary-across-domains/)
The datasets were not collected under one uniform protocol. METR describes differences in how benchmark scores are recorded, how task durations are assigned, and how much duration coverage each benchmark supplies. A benchmark may report a binary pass/fail outcome, while another may use a score with multiple possible values. Human-time information can likewise come from different sources or attach to tasks at different levels of precision. Before fitting a relationship between duration and performance, those inputs need to be made usable on a comparable scale. Transforming or normalizing scores allows analysis across unlike records, but it does not make their original meanings identical. A transformed score remains an analytic representation of the source benchmark outcome, rather than a newly observed common measure of workplace success. [How Does Time Horizon Vary Across Domains?](https://metr.org/blog/2025-07-14-how-does-time-horizon-vary-across-domains/)
Fit assumptions add another layer of choice. A horizon is read from a modeled relationship between task duration and performance, so the estimated crossing can depend on the form of that relationship and on how observations are weighted or transformed. METR compares fitting choices in its cross-domain analysis and reports that estimates are sensitive to these decisions in some domains. That sensitivity is informative: it shows where a compact duration threshold is more or less stable under plausible ways of summarizing the available benchmark records. It also means a difference between two domain estimates should not automatically be interpreted as a clean difference in underlying AI capability. The benchmark’s score structure, task-duration labels, observed range, and modeling assumptions may contribute to the reported contrast. [How Does Time Horizon Vary Across Domains?](https://metr.org/blog/2025-07-14-how-does-time-horizon-vary-across-domains/)
The observed duration range is especially important when a fitted curve is used to estimate a horizon beyond the tasks in the dataset. METR notes that some benchmark estimates require extrapolation because the available tasks do not extend far enough across duration to observe the threshold directly. In that situation, the reported horizon is a model-based extension of the measured relationship, not a threshold directly bracketed by observed examples. The farther the estimate reaches beyond the available duration data, the less the benchmark alone can show whether the assumed curve continues to describe performance there. Such estimates can still be useful for comparing scenarios under stated assumptions, but they deserve less weight as precise domain measurements than a crossing supported within the observed task range. [How Does Time Horizon Vary Across Domains?](https://metr.org/blog/2025-07-14-how-does-time-horizon-vary-across-domains/)
Cross-benchmark comparison therefore reveals domain dependence and measurement sensitivity, not a representative map of professions. Nine existing datasets are evidence about those datasets and their documented domains. They were not sampled to represent the full range of tasks people perform, and their task definitions, duration labels, outcome scales, and coverage differ. The analysis cannot tell a reader how much of a particular occupation is completed autonomously, because an occupational role combines tasks that may not resemble any of the included benchmark items and may apply different acceptance standards. Extending the result to professions would require evidence connecting specific job tasks to relevant evaluated work, including the inputs available and the conditions under which completion counts as adequate. That connection is not supplied by a domain label alone. [How Does Time Horizon Vary Across Domains?](https://metr.org/blog/2025-07-14-how-does-time-horizon-vary-across-domains/)
The counterpoint is that nonidentical benchmarks are not useless for exploration. Their comparisons can reveal whether a horizon-like relationship is detectable across several kinds of task and which conclusions shift when scores, duration coverage, or fit assumptions change. The useful reading is conditional: treat each estimate as attached to its benchmark and method, give greater caution to estimates with sparse duration coverage or substantial extrapolation, and use cross-domain variation as a reason to ask for task-specific evidence. The analysis supports neither universal transfer from the software-focused suite nor the claim that a horizon has no meaning outside software. It shows why broader application requires a separate, transparent evaluation for each domain rather than copying one suite’s number across unlike work. [How Does Time Horizon Vary Across Domains?](https://metr.org/blog/2025-07-14-how-does-time-horizon-vary-across-domains/)
How does the definition of success affect the horizon?
A task’s measured success depends partly on the endpoint chosen to score it. SWE-bench Verified illustrates a test-based endpoint. In *Introducing SWE-bench Verified*, OpenAI describes a subset of SWE-bench tasks that underwent human review for clarity and solvability, with benchmark performance determined by whether the submitted software change passes the task’s tests. That construction gives evaluators a reproducible outcome: for a particular task and patch, the tests either meet the benchmark’s pass criterion or they do not. The human review used to select the subset addresses whether tasks are suitable for evaluation; it does not make the benchmark outcome a maintainer’s decision to accept each patch into a project. [Introducing SWE-bench Verified](https://openai.com/index/introducing-swe-bench-verified/)
METR’s *Many SWE-bench-Passing PRs Would Not Be Merged into Main* examines that distinction through a selected audit of patches that passed SWE-bench tests. METR compared the automated pass result with maintainers’ decisions on whether the patches would be merged. In the audited sample, the two endpoints did not coincide for every patch: some that passed the tests were not judged mergeable by maintainers. The note treats the comparison as a limited audit and describes its trend estimates as noisy; it is not a census of all SWE-bench submissions or repositories. Its direct finding is that, in this selected set, passing the benchmark criterion did not guarantee a matching merge judgment. [Many SWE-bench-Passing PRs Would Not Be Merged into Main](https://metr.org/notes/2026-03-10-many-swe-bench-passing-prs-would-not-be-merged-into-main/)
A test pass and a merge decision answer related but different questions. The automated criterion checks specified behavior against a defined test suite. A maintainer deciding about a real project may also consider whether the patch fits project conventions, is understandable, avoids undesirable side effects, works with surrounding components, and is suitable to maintain. Those concerns may be partly encoded in tests, but only to the extent that the test suite captures them. The audit’s disagreement is evidence that this particular automated endpoint and the reviewed maintainers’ endpoint can diverge; it does not establish why every individual patch was not merged, nor that each non-merged patch was defective or useless. [Many SWE-bench-Passing PRs Would Not Be Merged into Main](https://metr.org/notes/2026-03-10-many-swe-bench-passing-prs-would-not-be-merged-into-main/)
The distinction matters when interpreting a time horizon built from task outcomes. If the task’s recorded success is test passage, then the fitted relationship describes performance against that defined criterion. It does not silently include downstream review, integration, release readiness, or maintainers’ approval unless those are part of the task and scoring procedure. This is a practical inference from how endpoints work, rather than a separate result measured by METR’s audit: organizations can define acceptable completion more broadly or narrowly according to their workflow. For a task where a tested patch still requires substantial review or adaptation, time to pass the benchmark’s tests and time to reach the organization’s accepted result are distinct quantities. The horizon by itself does not measure the difference between them. [Introducing SWE-bench Verified](https://openai.com/index/introducing-swe-bench-verified/); [Many SWE-bench-Passing PRs Would Not Be Merged into Main](https://metr.org/notes/2026-03-10-many-swe-bench-passing-prs-would-not-be-merged-into-main/)
That narrower scope does not make the automated endpoint invalid. A fixed test suite can apply a consistent, repeatable rule across submissions, while human review may vary with maintainers, project priorities, and context. The test-based result is useful when the question is whether the benchmark-defined behavior was satisfied. The merge judgment is more relevant when the question is whether a patch meets a project’s acceptance standard. Neither measure is universally superior: choosing between them depends on the decision being made. Read a benchmark pass as success under its stated test criterion, and read METR’s audit as evidence that this criterion and maintainer acceptance were not interchangeable in the reviewed sample. [Introducing SWE-bench Verified](https://openai.com/index/introducing-swe-bench-verified/); [Many SWE-bench-Passing PRs Would Not Be Merged into Main](https://metr.org/notes/2026-03-10-many-swe-bench-passing-prs-would-not-be-merged-into-main/)
The endpoint also affects what a duration-linked result can be used to compare. If two agents are evaluated on the same task set with the same tests, their scores share a stable operational rule, even if that rule captures only one layer of completion. If the intended decision concerns a broader standard, the comparison needs an outcome that represents that standard, or a separate measure of what happens after the test result. This does not mean every benchmark must simulate an entire software organization; adding subjective review can introduce its own inconsistency and cost. It means the interpretation should follow the endpoint actually recorded. The SWE-bench construction account establishes what the test result represents, while METR’s selected audit supplies a concrete reason to keep test passage and merge approval as separate outcomes. [Introducing SWE-bench Verified](https://openai.com/index/introducing-swe-bench-verified/); [Many SWE-bench-Passing PRs Would Not Be Merged into Main](https://metr.org/notes/2026-03-10-many-swe-bench-passing-prs-would-not-be-merged-into-main/)
Sources: Many SWE-bench-Passing PRs Would Not Be Merged into Main; Introducing SWE-bench Verified
What separate evidence measures AI-assisted developer productivity?
No. METR’s autonomous time horizon and its randomized developer productivity trial measure different outcomes. A horizon estimates the duration of benchmark tasks at which an AI system reaches a chosen success level when working autonomously in the evaluation setup. The developer study instead asked what happened to experienced people’s task completion time when they could use AI tools while doing their own software work. Its result is therefore relevant to human-plus-tool workflow in the study setting, not a correction to the horizon or an estimate of a worker’s job exposure. The two findings can coexist: a system may complete some longer bounded tasks on its own while adding friction to a developer’s particular process when used as an assistant. Neither measurement substitutes for the other, because one concerns autonomous task performance and the other concerns elapsed time for a person working with optional assistance. [Measuring the Impact of Early-2025 AI on Experienced Open-Source Developer Productivity](https://metr.org/Early_2025_AI_Experienced_OS_Devs_Study-paper.pdf)
METR’s trial involved 16 experienced open-source developers and 246 tasks drawn from repositories those developers knew well. The researchers randomized whether AI tools were available for a task, giving the study a comparison between allowed-AI and no-AI conditions within the participants’ work. The intervention reflected tools available in early 2025; it did not test every current coding assistant, model, integration, or way of introducing assistance. The familiar repositories and experienced participants make the task setting more grounded in real software work than a purely autonomous benchmark, but they also define a narrow population and environment. The sample was small and specialized, and tasks came from selected repositories rather than a representative cross-section of all software development. A randomized design can support a causal comparison within those studied conditions; it does not make that estimate universal across developers, task types, workplaces, or later tools. [Measuring the Impact of Early-2025 AI on Experienced Open-Source Developer Productivity](https://metr.org/Early_2025_AI_Experienced_OS_Devs_Study-paper.pdf)
Under those trial conditions, developers took 19% longer on average to complete tasks when AI tools were allowed. This is the reported average completion-time effect for the study’s participants and tasks, not a claim that every participant or every task slowed by 19%. The number also does not say that AI tools have no value: completion time is one outcome, and a team might value other outcomes such as learning, throughput across a portfolio, or work that would otherwise not be attempted. Those benefits would need separate measurement rather than being presumed to cancel out the observed time result. Likewise, the estimate does not establish that access to AI causes slower work in every setting. It records what happened under a defined early-2025 intervention and task sample, including the actual way participants chose to use the available tools. [Measuring the Impact of Early-2025 AI on Experienced Open-Source Developer Productivity](https://metr.org/Early_2025_AI_Experienced_OS_Devs_Study-paper.pdf)
The trial’s completion-time result does not by itself identify why the assisted condition took longer. It is plausible that an individual workflow can include time spent prompting, checking generated code, correcting errors, or fitting a suggestion into surrounding code; these are possible interaction and review costs, not causes established merely by the average time comparison. Unless a measured variable in the paper isolates one of those mechanisms, the result should not be narrated as proof that any particular step created the delay. The same caution applies to explanations based on task selection, participant choices, or tool behavior: they may help formulate questions about a workflow, but they do not replace the measured outcome. Keeping the observed result separate from plausible explanations preserves what the experiment can tell us without turning a single average into a general theory of how developers use AI. [Measuring the Impact of Early-2025 AI on Experienced Open-Source Developer Productivity](https://metr.org/Early_2025_AI_Experienced_OS_Devs_Study-paper.pdf)
For a workplace decision, the useful productivity measure is the effort required to reach the organization’s defined acceptable result, not simply the time until an AI produces a candidate answer or a developer finishes a first draft. A comparison would need to include the person’s interaction time and the review, correction, and integration needed to meet a stated quality standard. That is a practical implication of comparing workflow assistance with autonomous task scoring, rather than an additional finding from METR’s trial. A task may look fast at generation and still require substantial human effort before acceptance; another may need little intervention. The relevant comparison therefore has to use the same task boundary and endpoint in both conditions, and count the person’s work across the whole path to that endpoint. Otherwise, a quick suggestion can appear productive while review remains outside the clock, or a careful review can be counted as delay even when it is part of normal quality control. These are measurement choices that affect what a completion-time comparison means, not claims that METR observed one universal pattern of review. The trial’s average provides evidence that assistance did not automatically shorten completion time for its studied tasks. It does not settle which workflows benefit, nor whether a particular team should use a tool. Those questions turn on local tasks and the endpoint the team actually values. [Measuring the Impact of Early-2025 AI on Experienced Open-Source Developer Productivity](https://metr.org/Early_2025_AI_Experienced_OS_Devs_Study-paper.pdf)
Sources: Measuring the Impact of Early-2025 AI on Experienced Open-Source Developer Productivity
What conclusions can a worker draw from the number?
Use a METR horizon as a prompt to investigate a task, not as a conclusion about your occupation. The practical inference proceeds in three steps: first, identify the benchmark work and the standard that counted as success; second, compare that work with a recurring task you actually own, including its inputs, context, dependencies, and review burden; third, look for evidence in your own organization about whether the tool is permitted, integrated into the workflow, and producing an acceptable result. Only after those comparisons should you consider what the change means for your work. This is a reasoning method for applying a capability signal, not a separate empirical result supplied by the horizon. The number itself contains no estimate of whether an employer will adopt a tool or whether a role will be displaced. Those outcomes depend on decisions and conditions beyond the benchmark measurement.
A task match is stronger when the work has similar inputs, a bounded deliverable, and a comparable success check, and weaker when it depends on information or coordination absent from the evaluation. For example, hypothetically, a worker who regularly prepares a small code change from a clear issue might find a closer comparison to a software benchmark task than a worker whose coding work is inseparable from live customer discussion, legacy-system access, and approval across several teams. This example is illustrative, not a report about measured workers or a claim that either task can or cannot be automated. Even a close resemblance only makes the benchmark more relevant to investigate; it does not show that an employer has authorized the tool, that the full workflow is faster, or that the role will change in a particular way.
The decision point is local evidence. A worker can ask whether the tool is approved for the relevant data, whether it fits the software and handoffs already in use, and what happens when its output is checked against the team’s normal acceptance standard. If those conditions are present, observed workflow results can inform whether to adapt a task or build a skill around it. If they are absent, the horizon remains general capability context rather than a reason on its own to retrain or make a larger career move. The benchmark signal still matters: it can help prioritize which tasks deserve closer inspection, especially where the task match is plausible. Its value lies in narrowing the question to test locally, while decisions about staffing, role design, and demand remain contingent on organizational choices and labor-market conditions. A useful record can be simple: name the recurring task, the information available when it begins, what counts as a satisfactory result, and who checks it. Then distinguish a tool demonstration from repeated use in the actual workflow. One successful demonstration may show that a task is technically approachable under those conditions; repeated use can reveal whether setup, exceptions, or checking make it worthwhile in practice. This record helps keep the comparison concrete and makes it easier to discuss the task with a manager or workflow owner without treating an aggregate benchmark as a personal score. It also leaves room for constraints such as restricted data or approval requirements to shape the next step.
For a career judgment, keep the steps distinct: benchmark capability may make a similar task worth examining; actual workflow evidence can show whether assistance changes time or quality in a particular setting; employer adoption and work redesign determine whether that change becomes part of a job; labor demand and staffing choices shape what follows for roles. This sequence does not imply that capability evidence is irrelevant until every workplace fact is known. It gives that evidence an appropriate weight: informative about what a system can do under evaluated conditions, increasingly conditional as the claim moves toward an organization’s workflow, and insufficient by itself to estimate displacement. The reader can draw a reason to investigate a recurring task, but not a numerical personal risk or a forecast about employment from the horizon alone.
What is the next proportionate step?
Choose one recurring task that plausibly resembles the evaluated software work, then describe the output you need and the standard by which someone reviews it. Ask the person responsible for that workflow whether a supervised comparison is permitted, including whether the relevant data and tools are approved. Keep the comparison small enough to observe the whole path to an acceptable result: preparation, tool use, checking, correction, and handoff. This is a practical way to turn general capability context into a local question; the horizon itself does not answer whether your team should adopt a tool or change a role.
You do not need to design a formal experiment or prove a business case. If the task is close enough and an authorized test is available, agree in advance what a useful result would look like and who will review it. A single attempt can surface questions, but should not be treated as evidence of sustained performance. If no comparable task exists, access is restricted, or you lack authority or time to test it, write down the task and its normal acceptance standard and discuss them with the workflow owner. That conversation is a sufficient next step. The number remains broad capability context until workplace-specific evidence exists; it does not by itself justify buying training, changing careers, or assuming your work is at risk.
If you want help comparing possible career scenarios against constraints such as time, cost, location, and existing responsibilities, the paid career roadmap at /career-roadmap is the primary next resource. The free checker at /ai-job-risk-checker offers task-level change-pressure signals and initial actions. Neither provides a validated probability that an individual will be displaced, and neither guarantees employment or income. For now, take one action: identify a recurring task and ask its workflow owner whether a supervised, approved comparison is possible.
Sources and notes
- Task-Completion Time Horizons of Frontier AI Models
The current dashboard defines its 50% time horizon as the human-expert task duration in its suite at which it predicts 50% agent completion; it describes current tasks, human timing, agent setup, FAQ interpretation limits, task-level outcome distributions, and uncertainty around high-reliability estimates.
- Measuring AI Ability to Complete Long Software Tasks
The peer-reviewed METR paper proposes the 50%-task-completion time horizon and reports human timing on RE-Bench, HCAST, and 66 novel shorter tasks; it describes its model/task evidence, historical trend analysis, and external-validity limitations.
- Time Horizon 1.1
METR documents its later task-suite and infrastructure revision, re-evaluation and cross-version comparisons, finding only minor estimated horizon differences for three models on the new suite under Vivaria and Inspect while describing task composition and uncertainty concerns.
- How Does Time Horizon Vary Across Domains?
METR applies time-horizon analysis to nine existing benchmarks and reports heterogeneous results by domain; the analysis uses differing score and human-time inputs, alternative fitting assumptions, and in some cases extrapolates beyond observed task durations.
- METR eval-analysis-public
Public source code and documentation describe analysis and data-processing steps for fitting success against human task duration and producing version-specific estimates.
- Many SWE-bench-Passing PRs Would Not Be Merged into Main
METR’s audit compares automated benchmark grading with maintainer merge decisions for a selected sample of SWE-bench patches, showing that alternative outcome definitions can change which patches count as successful.
- Introducing SWE-bench Verified
The benchmark developer describes the human review used to identify SWE-bench tasks judged clear and solvable and the benchmark’s unit-test-based outcome criterion.
- Measuring the Impact of Early-2025 AI on Experienced Open-Source Developer Productivity
A randomized trial with 16 experienced open-source developers completing 246 tasks in repositories they knew well reported 19% longer average completion time when AI tools were allowed under the study’s early-2025 conditions.
Apply this to your own work
See the whole job market at once.
Explore which occupations AI may reshape, then turn the signal into a practical response.
Explore the job map