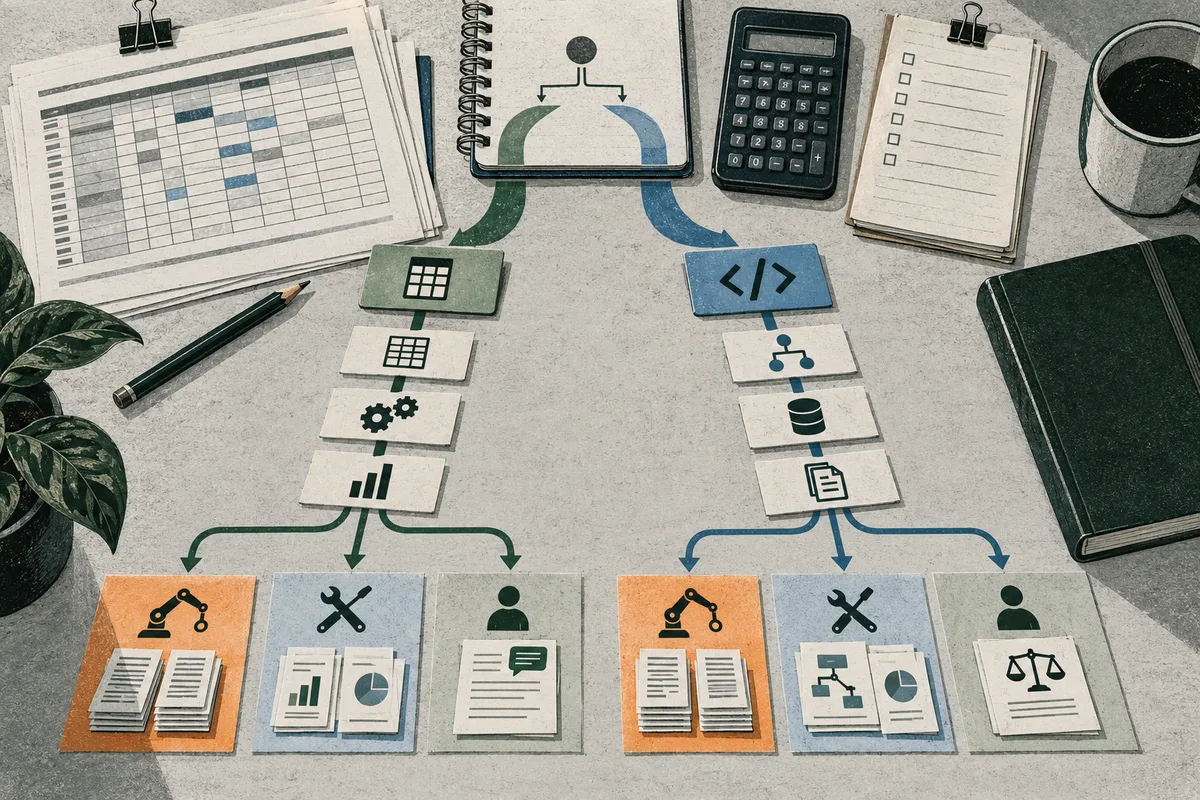
Start with spreadsheet automation when a recurring task begins and ends in a supported workbook. Learn Python when a concrete cross-file, cross-system, or analytical requirement exceeds spreadsheet tools and your workplace can review and maintain the code. AI exposure alone does not choose the tool or predict job loss. Map one changing task’s inputs, transformations, checks, output, and handoff before committing to a learning path.
Why the job title cannot choose the tool
For a mid-career analyst, learn the tool that fits the work step changing, not the job title or an exposure score. If a recurring task starts and ends in a supported workbook, spreadsheet automation is the sensible first test. If it must cross systems or needs code beyond the spreadsheet environment, Python may fit, provided the workplace can support and review it. O*NET’s Business Intelligence Analysts profile shows why “analyst” is too broad to settle the question. Listed duties include generating reports and maintaining BI tools, alongside testing whether information meets defined needs and synthesizing trends to support recommendations. The profile displays importance ratings, not the share of an individual worker’s time spent on each task. It is a U.S. occupational description, useful as a bounded example rather than a template for every analyst or location. Consider a monthly variance report assembled from several exports. Repeated work might include cleaning column names, joining files, checking totals, and preparing the same workbook for review. Other steps may involve deciding whether an unusual result reflects a data problem or a real change, interpreting the variance, and explaining it to stakeholders. These steps belong to one process but pose different learning problems: repeated transformations may suit automation, while interpretation and recommendations still require context and review. Map the task from source files to final handoff before choosing a course. Ask what repeats, where data lives, what output colleagues use, which checks catch mistakes, and who reviews the result. If the path stays inside an approved workbook, test spreadsheet automation. If a concrete requirement crosses systems or exceeds available spreadsheet tools, investigate Python and who could maintain the code. This map gives the comparison a real decision to resolve.
Sources: Business Intelligence Analysts
What AI exposure tells you—and what it does not
Exposure evidence can point you toward tasks worth inspecting, but it cannot tell you whether your employer adopted AI, whether a system performs them reliably in your workflow, or whether your job will disappear. It cannot choose spreadsheet automation versus Python by itself. Treat exposure as a reason to inspect a changing task; choose a learning path from its inputs, tools, checks and handoff. Keep the signals separate. Capability concerns what a system can do; exposure estimates which tasks could be affected. Actual use depends on access, data, workflow fit and policy. Employer adoption means a business uses AI in some function; it does not establish that a particular analyst uses it or that work has been redesigned. Labor demand reflects many forces. Displacement is a possible outcome, not a synonym for these signals. The International Labour Organization's 2025 paper, “Generative AI and Jobs: A Refined Global Index of Occupational Exposure,” estimates task applicability rather than observing workplaces. It combines task data, expert input and model predictions. Researchers sampled 29,753 tasks in Poland's occupational classification and surveyed 1,640 employed people across broad occupational groups about automation potential for 2,861 tasks; expert discussions and a model extended scores to the international classification. The paper estimates one in four workers globally are in occupations with some exposure. It describes job transformation as the most likely impact because most occupations include tasks requiring human input. These are population-level estimates, not a forecast for one analyst or employer. Applicability does not establish reliable performance, adoption, headcount change or individual displacement odds. The U.S. Census Bureau's Business Trends and Outlook Survey (BTOS) asks businesses whether they used AI in the past two weeks. Its analysis of data collected December 14, 2025, to May 3, 2026, reports overall use ranging from 17% to 20%. For the period ending May 3, 37% of firms with at least 250 employees and 32% of firms with 100–249 employees reported use. Finance and insurance businesses reported 33.9%, versus 19.8% nationally. These are business-level reports, not analyst-team measures, and do not specify which function used AI. Interpret time comparisons carefully. On November 17, 2025, Census changed its core question from AI used in producing goods or services to AI used in any business function. The broader wording limits direct comparison across that break. A sector rate cannot show whether your team has approved tools, where they are used, or what happens to staffing. Treat AI pressure as a prompt to locate the changed step and verify workplace conditions. A tool that drafts a formula or script still requires output checks, exception handling and data-policy compliance. Keep that investigation separate from the spreadsheet-versus-Python decision: ask which supported tool fits the recurring workflow and can be reviewed and maintained. Neither exposure estimates nor business-use percentages are personal job-loss probabilities.
Sources: Generative AI and Jobs: A Refined Global Index of Occupational Exposure; AI Use by Businesses Ranges from 17% to 20% Across the U.S.
What spreadsheet automation can cover before code is needed
Start with spreadsheet automation when recurring work begins with data an approved spreadsheet environment can reach and ends with an output people already review there. Power Query is a candidate for retrieving, cleaning, combining and reshaping supported sources. Office Scripts handle workbook actions, formatting, workbook control and Power Automate integrations. In “When to use Power Query or Office Scripts,” Microsoft describes both as rerunnable on new data but assigns them different roles. This is a workflow choice, not a universal Excel-versus-code ranking.
Consider a monthly variance report built from exports. The analyst corrects data types, joins tables, refreshes the result, applies a workbook layout and sends it for review. If sources follow a supported import path, Power Query can encode retrieval and transformation steps for reuse. This may remove repeated copying. It does not decide whether a renamed field still means the same thing, whether a missing category is an error, or whether a variance deserves escalation. Reusable instructions do not supply judgment about changed definitions or unusual results.
Microsoft distinguishes Power Query’s retrieval, transformation and combination from Office Scripts’ workbook control. Its documentation describes scripts for formatting, visualizations and Power Automate integrations. First identify whether the burden is preparing data or acting on the finished workbook. A query may address cleanup and joins; a script may handle stable workbook actions or connect steps to a supported flow. Use both only when the handoff requires it.
Map failure points before selecting a feature. Files may be missing or arrive with changed columns; joins may leave unmatched keys; refresh may fail because of permissions; a connector may not support the source; or definitions may change. Automation does not erase these conditions. Keep exceptions visible and compare output with a known period or checked total. Record assumptions for a reviewer. Checks depend on the report; no single spreadsheet test validates every measure.
Platform support matters. The Microsoft page says the full Power Query experience was available only for Excel for Windows, while Office Scripts were available on the web, Windows and Mac, with both usable through Power Automate in the described setup. Last updated March 30, 2023, these details need rechecking. Licenses, connectors, tenant settings and workplace policy can constrain use. Confirm locally that a feature is enabled before building around it.
“Learn spreadsheet automation first” should mean testing one supported step. For a permitted monthly export, automate a stable transformation and retain checks for missing rows, changed fields and unexpected totals. If the bottleneck is formatting or a workbook action, check whether a script is supported and reviewable. If neither tool is approved, practice on synthetic data; do not move sensitive data into an unapproved connector.
Row count alone does not establish a spreadsheet’s boundary. Connectors, refresh limits and output matter. Microsoft documents supported connections and product uses, but gives no universal point where every workbook should give way to Python. That depends on a concrete requirement beyond available spreadsheet tools and whether someone can run, review and maintain code. Until one appears, choose the smallest supported spreadsheet function whose output a reviewer can inspect.
When Python's extra flexibility earns its overhead
Choose Python first when a recurring task has a requirement spreadsheet tools do not meet well: combining changing sources, processing many files, calling an approved interface, reusing code, or applying methods outside the workbook path. This case is strongest when the organization can approve and run the environment, review the work, and assign a maintainer. Otherwise, flexibility can add setup and handoff work without fixing the bottleneck.
Consider a monthly variance report. A spreadsheet workflow imports exports, standardizes columns and dates, joins reference data, checks totals, then delivers a familiar workbook. Power Query retrieves, transforms and combines data from supported sources; Office Scripts control workbook actions and connect with Power Automate. Microsoft's “When to use Power Query or Office Scripts” describes these as distinct Excel automation options. This is a useful baseline: it repeats preparation within a familiar handoff, but cannot determine that a source changed or a business definition no longer fits.
Suppose instead the report combines differently formatted files, applies a reusable rule across folders, or passes structured results into another approved system. Python may express those steps more cleanly as a program. Its advantage is not status; the task has crossed a boundary the spreadsheet route handles poorly. Also ask what happens after the first run: where the program executes, how packages are managed, who sees failures, and who can repair it when inputs change. A script without an owner can leave a less visible dependency than the workbook it replaced.
Learning Python asks for a different foundation. The official “Python Tutorial” says it is designed for programmers new to Python, not people new to programming, and expects basic programming knowledge. It introduces language features, modules, input and output, and errors. That describes its starting point; it does not estimate learning time or prove the tutorial prepares someone to maintain workplace software. For a cleanup inside an approved workbook, programming may exceed the need. When code is necessary, concepts such as functions and exceptions help make results inspectable.
A large row count alone does not settle the choice: Microsoft's documentation says Power Query is designed for retrieval, transformation and combination, including large datasets from supported sources. Check the actual connector and setup. Conversely, multiple files do not automatically make Python appropriate: APIs may be unapproved, credentials unavailable, or no one able to review and inherit the script. A spreadsheet feature can handle a complex report; a smaller task may justify Python if it needs a reusable method the workbook lacks.
Use a named requirement as the threshold: identify the input, transformation, output or maintenance problem the spreadsheet route cannot handle reliably. Check that Python is permitted and a reviewer and future owner exist. If so, test a small version against known totals and records to flag. If not, use the supported spreadsheet option or clarify permission and ownership first. Choose the skill that improves a real workflow and leaves its result understandable and maintainable.
Sources: The Python Tutorial; When to use Power Query or Office Scripts
How do verification and handoff change the comparison?
The better first tool is the one whose result can be checked and safely handed to the next person, not simply the one that performs more steps. A spreadsheet query and a Python script can both repeat a transformation; neither establishes that the chosen definition is correct. For a monthly variance report, treat verification and handoff as part of the task itself. Begin with a permitted, bounded sample and preserve a known result from a prior period. Before automating, write down expected row counts, key totals and a few category-level totals. After the transformation, compare the new output with the expected counts and totals. Keep malformed dates, unmatched keys, duplicate records and missing files visible for review instead of silently dropping or correcting them. Decide in advance who resolves each exception and whether the report should stop or continue when it appears; that rule is part of the workflow, not a cosmetic choice. Then inspect the work at two levels: the result and the steps that produced it. In a workbook, a reviewer might follow the query steps, formulas, refresh status and assumptions about column names or categories. In Python, review the code, inputs, dependencies, error handling and any record of what ran. Microsoft’s “When to use Power Query or Office Scripts” documentation distinguishes data retrieval and transformation from workbook actions and integrations; it also describes rerunning a query or script on new data. Python’s official tutorial introduces language concepts, errors and exceptions, and says it assumes basic programming knowledge. A domain-aware person still needs to check what a metric means and whether an unusual result deserves escalation. Handoff makes that review repeatable. Leave a short note with the source files or approved connection, transformation assumptions, expected checks, known exceptions, refresh or run instructions, and the person or team responsible for changes. Include a simple example of a valid input and the expected output where policy permits, so a successor can tell whether a later change is intentional. Use the organization’s approved storage and access controls; never move sensitive records into an unapproved tool simply to make a test convenient. Undocumented steps can leave the next analyst unsure when a changed file or business definition invalidates the result. Automation can repeat an incorrect rule consistently, so a clean run is not itself evidence of correctness. The same standard applies if an AI system drafts a formula or script: treat it as proposed work, inspect each transformation, and compare its output with independently established checks. If review capacity, approval, or a maintainer is missing, use synthetic data to learn the permitted concepts or pause implementation while that constraint is resolved. Choose a tool only when its result can survive those checks and someone can take responsibility for it.
Sources: When to use Power Query or Office Scripts; The Python Tutorial
Why the same task-change signal can lead to different learning choices
Two analysts facing similar AI pressure can reasonably choose different first skills because workflow boundaries, approved software, review capacity and outputs differ. Exposure can identify tasks worth inspecting; it does not select a tool. Map where data arrives, what changes, how results are checked, who receives them and who maintains the process. That may reveal a spreadsheet need, programming requirement or barrier to live use.
Imagine an analyst who receives three standardized monthly exports and delivers a reconciled workbook. The columns and definitions are stable, the organization supports a query feature, and a colleague can review the result. Spreadsheet automation may be the sensible first experiment: it can repeat known retrieval and transformation steps while preserving the familiar handoff. The analyst must still notice a missing source, a changed definition or an unusual value. Refreshing a query does not explain a variance or make a recommendation accountable. O*NET’s Business Intelligence Analyst profile lists reporting, maintaining tools, testing outputs and synthesizing trends for recommendations in one occupational bundle; its importance ratings do not measure an individual’s hours or task shares.
Consider a different workflow: approved data comes from multiple systems, file structures change, and the deliverable is both a workbook and structured output for another process. Python may be worth learning first if the connections and transformations exceed supported spreadsheet capabilities and a code owner can review, run and maintain the result. It brings setup, error handling and handoff requirements. The official Python Tutorial is aimed at programmers new to Python and assumes basic programming familiarity; it does not show that code is effortless or that a short lesson prepares someone to maintain production work. A cross-file task alone does not justify Python if the organization cannot approve the software, provide access or assign maintenance.
These are decision illustrations, not observed cases or forecasts. In either workflow, separate repeated preparation from judgment: deciding whether a metric still means the same thing, investigating anomalies and explaining a recommendation. Microsoft’s Power Query and Office Scripts comparison describes distinct spreadsheet capabilities, while Python’s documentation establishes a programming path; neither proves which option brings a better career return. Governance can reverse the apparent fit. A workbook feature may be unavailable under team policy; an approved Python environment may already have review and ownership practices. Check those conditions and what the next user needs to inspect before live use.
Choose by workflow boundary and support. If the task starts and ends in a supported workbook, test spreadsheet automation against a known output. If a concrete need crosses that boundary, test Python only where access, review and maintenance exist. If neither condition is met, clarify permissions, data access or ownership, or practice on synthetic data. Similar pressure signals do not imply identical learning choices, and no universal task-share formula replaces this local map.
Sources: Business Intelligence Analysts; When to use Power Query or Office Scripts; The Python Tutorial
What the existing comparison advice misses
Broad Excel-versus-Python advice can orient a learner, but a mid-career decision should begin with the task changing and constraints on using its output. A general sequence cannot tell you whether a monthly reconciliation belongs in a workbook, script or smaller first step. Nor does an exposure signal answer that question: exposure concerns whether capabilities may apply to tasks; actual use depends on local systems, permissions and workflow choices. Employment outcomes are further removed. Choose from evidence about the work, not a broad skill ranking. “Python vs Excel for Data Analysis: Which Should You Learn First?” offers a general comparison: Excel for quick analysis and editable outputs, Python for repeatable work, larger data and complex cleaning, followed by a spreadsheet-to-SQL-to-Python sequence. It says recurring reports are a Python task and makes employability claims. This may orient a learner, but it does not compare the tools for a particular experienced analyst’s approved sources, review, handoff or maintenance capacity. A publisher’s recommended sequence is not a measured estimate of which path improves this reader’s prospects. The useful question is whether the repeated transformation fits the environment the team supports or crosses a concrete boundary. “Excel or Python First? What Data Analyst Job Postings Actually Say” instead presents percentages for spreadsheet, Python or R, and SQL mentions, then recommends a beginner learning order. It attributes figures to analyses across several job sites and cautions that percentages vary, but the opened page gives too little detail to assess sample, collection rules, deduplication, geography or seniority. Even a sound posting count describes advertised requirements in a defined market and period; it does not establish the return for an experienced analyst in a current role or choose a tool for that workflow. The entry-level framing also leaves approval, code ownership and verification outside the decision. Official sources answer different questions. “Business Intelligence Analysts” in O*NET describes an occupational task bundle; the ILO’s “Generative AI and Jobs: A Refined Global Index of Occupational Exposure” estimates technical task applicability. Neither compares employment outcomes for learning Power Query versus Python, and neither measures an individual employer’s adoption. Treating them as a skills verdict would ask evidence to answer something it did not study. The useful contribution is a workflow-fit comparison, not another universal ranking. Trace the task from input through transformation, checks and handoff; identify approved tools, exception paths and who can maintain the result. Spreadsheet automation is a sensible first test when the path stays workbook-centered. Python earns its overhead when a specific cross-file, cross-system or analytical need exceeds supported spreadsheet tools and code can be reviewed and maintained. If neither condition is clear, map the workflow before buying a course or making a larger career move.
Sources: Python vs Excel for Data Analysis: Which Should You Learn First?; Excel or Python First? What Data Analyst Job Postings Actually Say; Generative AI and Jobs: A Refined Global Index of Occupational Exposure
Why a larger career move is not the default response
A change in some analyst tasks is not sufficient evidence to abandon an established career. First test whether a proportionate upgrade can address the changing work while preserving useful domain knowledge. Consider a larger move only when the actual role and your constraints support it. Task transformation, occupational demand and an individual outcome are different questions. A report may include automatable preparation while still requiring someone to define a measure, investigate an unusual result and explain a recommendation. O*NET’s Business Intelligence Analyst profile lists report generation and tool maintenance alongside testing outputs and synthesizing trends for recommendations. Its importance ratings describe a U.S. occupational profile, not any analyst’s weekly task shares. Inspect the work bundle before treating a changed task as proof that the whole role has lost value. Labor projections add context, but cannot settle a personal tool choice. The U.S. Bureau of Labor Statistics’ “Artificial intelligence, information technology, and employment, 2024–34” reports projected growth in some technical and analytical occupations, including data scientists, and expected declines in several office and administrative support occupations. These national projections do not compare spreadsheet automation with Python or predict one analyst’s outcome. They cannot show that learning either tool will produce a job, raise income or prevent displacement. Task change and occupational demand can move differently. A bounded upgrade is sensible when the task is specific. Spreadsheet automation may address repeated workbook-centered preparation; Python may fit a verified need that crosses files or systems, if the workplace can run and maintain code. Preserve knowledge of definitions, data quality and how results inform decisions. An adjacent step could involve documenting specifications, tracing data issues, interpreting exceptions or reviewing automated outputs. These are options to examine, not claims that employers are adding duties or that they guarantee demand. Consider a larger transition when the changing task mix, available adjacent work and personal goals point that way, not simply because AI appears in an exposure result. Compare prerequisites, study time, cost, salary floor, location, health and family responsibilities. A degree, course, certificate, project or self-study plan differs in cost and depth; none assures a career outcome. If approved software, data access, review or code maintenance is missing, a permitted learning exercise or workplace conversation may be better than a major purchase or job change. Keep the next commitment reversible: map one recurring task, its inputs, output, checks and handoff, then test a suitable skill on permitted sample data. The free task checker organizes task-level change-pressure signals; it does not provide a validated probability of displacement. Treat a result as a prompt to investigate, not a verdict on whether to stay.
Sources: Artificial intelligence, information technology, and employment, 2024–34; Business Intelligence Analysts
How to test the first skill without betting your career on it
Pick one recurring task that is changing, check which software and data practices your workplace permits, and test one bounded step on a sanitized or synthetic sample. Compare it with an output you understand. The aim is to find whether spreadsheet automation or Python addresses a real gap, not to prove a tool protects a job.
Map the task in four parts: input, transformation, needed output, and reviewer or next user. Mark repeatable steps versus judgment. In a monthly report, column cleanup may be separable from deciding whether a metric change reflects a real business shift. Automating preparation does not settle definitions, explain unusual results, or own a recommendation. State success and failure criteria before choosing a lesson.
Match the tool to the data route. If the work stays in an approved workbook and its transformations are supported, try the smallest relevant spreadsheet feature. Microsoft Learn’s comparison of Power Query and Office Scripts distinguishes data retrieval and transformation from workbook actions and integrations; the page was last updated in March 2023, so check current platform support and local setup. If a specific requirement crosses that boundary, such as processing approved files from several sources, Python may be worth testing. The official Python Tutorial covers programming concepts and is aimed at people with basic programming knowledge. Neither source establishes learning time or career return.
Define checks first: compare row counts and key totals with the known output; inspect missing records, unmatched keys, malformed values, and exceptions; and, where suitable, compare one prior period. Record assumptions, failure cases, and who can review or maintain the automation. A rerun can repeat a mistake, so inspect formulas or code against source data and business rules. This practical method is not a guarantee against error or a proficiency measure.
If approval, access, or review is missing, use synthetic data or clarify rules before testing live work. A course can provide sequence and feedback, but completing a degree, certificate, course, or tutorial does not establish that you can safely own the workflow. The test should reveal whether your gap is spreadsheet transformation, programming fundamentals, or an organizational constraint such as access or code ownership.
The free AI Proof Work task checker organizes task-level change-pressure signals; it does not report job-loss probability or select a tool. Use it to inspect changing tasks. If you need to compare paths against experience, salary floor, location, learning time, or family constraints, the paid roadmap compares scenarios and builds a 30/60/90-day plan without guaranteeing employment or income. For now, choose one task, map its input and handoff, and test a small step with checks you can explain.
Sources: When to use Power Query or Office Scripts; The Python Tutorial
What should you learn first this month?
For recurring work that stays in an approved workbook, learn spreadsheet automation first. Learn Python when a concrete cross-file, cross-system or analytical need exceeds spreadsheet tools and the workplace can review and maintain the code. AI exposure alone does not decide between them. Follow a task you can name, not a prediction about your job title.
Keep that verdict conditional on the environment. Microsoft’s Power Query and Office Scripts comparison documents different spreadsheet automation roles; confirm current platform support before choosing a feature. The Python Tutorial assumes basic programming familiarity, a reminder that code brings concepts and upkeep. Either option is a poor first move if policy blocks its use, no reviewer can check the result, or nobody can inherit the workflow.
This month, choose one recurring task whose inputs or handoff are changing. Map its source, repeated transformations, output and checks for errors. If the path remains workbook-centered, try one spreadsheet transformation against a known output. If it crosses a boundary spreadsheet tools cannot handle, and code can be reviewed and maintained, begin with the smallest Python concept that addresses it. If permission or ownership is missing, clarify that before automating live work. The free task checker can organize change-pressure signals; its result is not a probability of job loss. Test one task, then let the observed constraint choose the next lesson.
Sources: When to use Power Query or Office Scripts; The Python Tutorial
Questions readers ask
Should a mid-career analyst learn spreadsheet automation or Python first?
Start with spreadsheet automation if the recurring task stays in a supported workbook. Choose Python when a concrete requirement exceeds spreadsheet tools and the workplace can run, review, and maintain code.
Does AI exposure mean an analyst should learn Python?
No. Exposure can identify tasks to inspect, but it does not establish workplace adoption or select a tool. Choose from the task’s inputs, transformations, checks, output, and handoff.
How can I test which skill I need?
Map one changing task, check workplace software and data rules, then test a bounded step on a sanitized or synthetic sample. Compare it with a known output and identify who can review and maintain it.
Sources and notes
- Business Intelligence Analysts
O*NET lists reporting, BI tool maintenance, output testing, and trend synthesis in the BI analyst task profile; its importance ratings are not an individual worker’s task shares.
- Generative AI and Jobs: A Refined Global Index of Occupational Exposure
The ILO 2025 index estimates task-level technical exposure using task data, expert input, and model predictions; it does not measure an individual’s displacement odds.
- When to use Power Query or Office Scripts
Microsoft distinguishes Power Query data retrieval and transformation from Office Scripts workbook actions and integrations, and documents platform details that require current local verification.
- The Python Tutorial
The official tutorial is for programmers new to Python and assumes basic programming knowledge; it does not establish learning time or workplace readiness.
- AI Use by Businesses Ranges from 17% to 20% Across the U.S.
Census BTOS reports business-level AI use from December 14, 2025, to May 3, 2026, with variation by firm size and sector; it does not measure analyst-team use.
- Artificial intelligence, information technology, and employment, 2024–34
BLS summarizes national 2024–34 projections for selected occupations; they do not compare tool-learning returns or predict an individual analyst’s outcome.
- Python vs Excel for Data Analysis: Which Should You Learn First?
The opened article offers a broad Excel and Python comparison and learning sequence, leaving workplace approval, verification, and handoff constraints unresolved.
- Excel or Python First? What Data Analyst Job Postings Actually Say
The opened article focuses on entry-level posting mentions and does not establish a current analyst’s workflow choice or individual career return.
Apply this to your own work
See the whole job market at once.
Explore which occupations AI may reshape, then turn the signal into a practical response.
Explore the job map