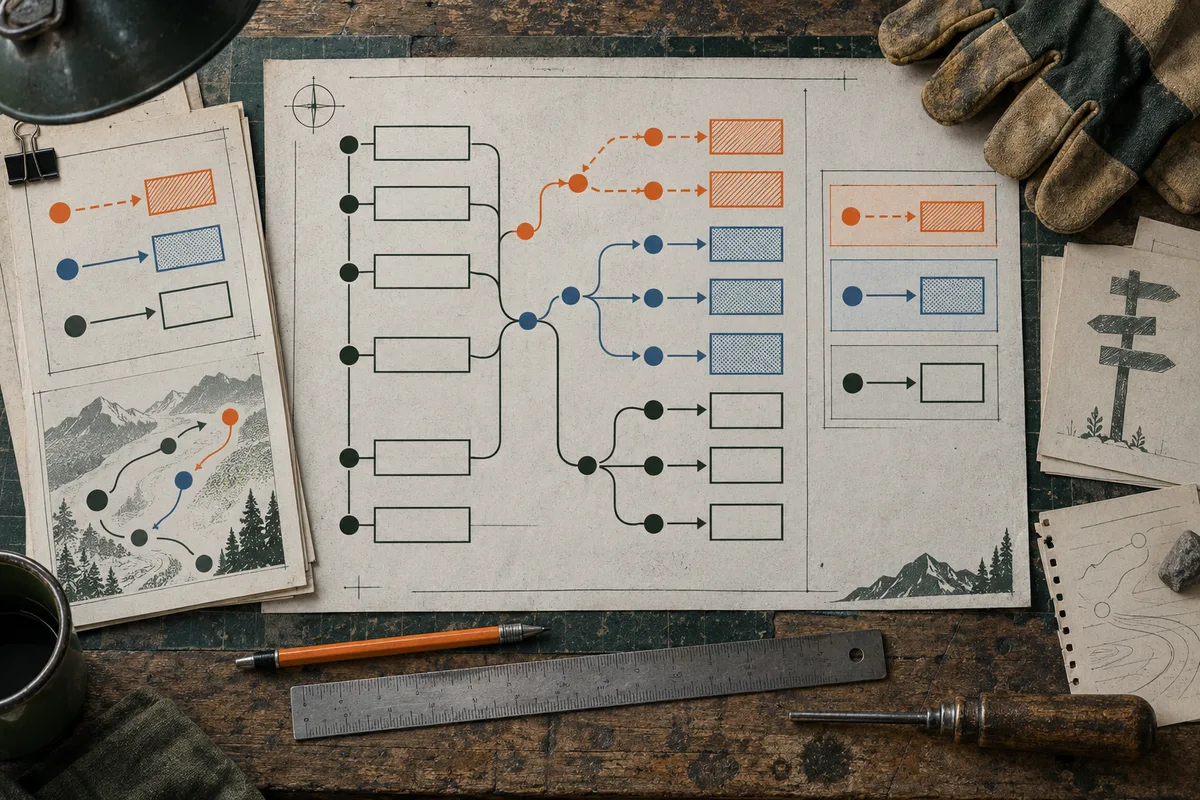
Anthropic’s June 2026 Economic Index added a monthly survey of Claude users and linked answers from about 9,700 respondents to a short window of their recent Claude activity. The addition lets readers compare classified product use with workers’ reported task capability, expectations, and job concerns. It broadens evidence beyond usage logs, but the selected Claude-user sample, self-reported measures, and platform-specific usage window do not establish general workforce adoption, employer plans, or displacement. Use the findings to ask which tasks in your work are changing, then check against local workflow and employment evidence.
The important change is a new view of work, not a job-loss forecast
If you are deciding whether to learn a tool, ask for different work, or leave a role, Anthropic’s June 26, 2026 Economic Index report gives you more context than its earlier usage analyses did. It links classified recent Claude sessions with answers from people who use Claude about what AI can do in their work, what they expect next, and how they think their jobs may change. The addition matters because a record of product activity cannot reveal by itself whether a worker believes an output is useful, where they see quality limits, or what changes they expect from an employer.
The linked survey sample comprises about 9,700 respondents who use Claude, not a representative sample of all workers. Its questions capture perceptions and expectations, while its session analysis captures activity on covered Claude surfaces. Neither directly measures whether an employer has adopted a system across a workflow, whether a role has been redesigned, or whether a person has lost a job. The addition broadens the picture without converting it into a personal forecast.
A useful reading rule is to keep four columns separate: observed product activity, workers’ reported beliefs about capability, expectations about future change, and workplace or labor-market outcomes. Each column answers a different question. When signals line up, that is a reason to investigate a task more closely. When they diverge, the gap is informative too. Neither alignment nor disagreement produces a job-loss probability.
A headline saying “AI can do this task” may refer to a respondent’s opinion, a modelled estimate of technical exposure, or a task already appearing in conversations with a particular service. Those statements differ in unit, population, and evidence. The 2026 addition makes those differences more visible because activity and self-report appear in a linked analysis, but linkage does not make the constructs interchangeable.
For a worker, examine recurring tasks, then compare public evidence with local evidence. A survey can help identify questions; it cannot tell you what your manager has decided, how customers judge quality, or which responsibilities your role carries. Use this release to sharpen questions about work, not to make an irreversible move from an aggregate statistic.
The report’s other 2026 changes should not be confused with the survey. More frequent sampling can expose rhythms in when users access the service; artifact classification can describe what outputs conversations appear to produce. Neither change adds a worker’s view of job quality. The survey does that, through questions asked of people rather than inferences drawn solely from conversation content. This matters for a reader comparing editions: a changed chart may reflect a different classifier, product surface, or sample design, while a new survey result reflects a new instrument. The date marks several methodological developments, not one single switch from incomplete data to complete evidence.
What did Anthropic add in 2026?
Anthropic announced a monthly Economic Index Survey in April 2026 and published its first linked findings in June. The launch announcement said invitations would go to a small randomly selected group of Claude users whose personal accounts were at least two weeks old, with a rotating group invited monthly. The survey asks about current work, tasks handed off, productivity, role or organizational changes, expectations for the next year, and hopes for a longer-term transition. It is a respondent study nested inside a company’s product-user population, not a survey drawn from a national worker register.
For the June analysis, Anthropic linked survey answers to a sample of each respondent’s Claude sessions from mid-May to early June using a privacy-preserving system. It randomly sampled up to 20 sessions per person across Claude.ai, Cowork, and Claude Code, then excluded respondents with fewer than five sampled sessions to reduce noise. The final linked analysis included about 9,700 people. This allows comparison between answers and a short window of use on those surfaces; it does not observe every work task, every AI product, or the employer’s whole workflow.
The report also changed its usage-data pipeline: it sampled more frequently, added a classifier for conversation outputs, and reported more granular results for chat and Cowork versus the first-party API. Those changes are relevant context but separate from the worker-reported addition. The survey is the new route to perceptions and expectations; higher-frequency sampling and artifact labels refine what the company can say about its own observed activity.
A random invitation can improve selection within a defined pool, but the pool still matters. Randomly inviting Claude account holders does not make them representative of all employed people. The invited user must choose to respond, and the analysis applies a minimum-use filter. Anthropic says the survey is not representative of the general population and describes occupational differences between respondents and U.S. employment.
The survey is complementary. Anthropic’s April announcement says usage and diffusion metrics capture deployment, while labor indicators such as employment and wages capture outcomes after the fact, often with delay. Worker accounts can add a nearer-term view of perceived change. That is a useful measurement goal, but an intended early signal should not be presented as a verified forecast. The design expands what can be asked; it does not remove limits of sampling, self-report, or causal inference.
The linked design is valuable precisely because the survey and logs can be considered together, not because they become one objective measure. A respondent’s recent session sample is short and may not represent seasonal work, infrequent but consequential tasks, or activities carried out in other software. The questionnaire asks about the person’s work more broadly than the sampled sessions can cover. Readers should not infer that a session label validates the worker’s whole account or that a worker answer validates a classifier. They answer related but distinct questions.
Sources: Anthropic Economic Index report: Cadences; Announcing the Anthropic Economic Index Survey
What could usage records show before the survey?
Before the survey, the Economic Index mainly inferred patterns from interactions on Claude. Classifiers mapped conversation content to tasks and occupations and distinguished ways a request appeared to involve automation or augmentation. The earlier paper, Which Economic Tasks are Performed with AI?, describes privacy-preserving analysis and explicitly says it gives a picture of usage on a single platform. Product logs can show what people ask that product to do, not all work they perform or all AI systems available to them.
Usage records have real strengths. They capture interactions close to the moment of use, can be grouped repeatedly, and make it possible to ask whether people request a complete output or work through iterations. These are more behaviorally specific than a broad question such as “Do you use AI?” If someone asks a tool to draft a report, then revises it over several turns, the trace represents a different interaction pattern from a single instruction to produce a finished document.
But a conversation trace is not a complete workflow. It may omit work in another tool, private systems, paper records, meetings, or unlogged verification. A task label inferred from language may not capture stakes, exceptions, or local quality standards. Similar requests can sit inside very different jobs: one may be practice material; another may be client-facing and require an accountable professional to validate every statement.
The earlier paper’s automation-like and augmentation-like categories classify observed conversational patterns; they do not directly measure headcount. A user can delegate a bounded step while still owning the workflow. A collaborative exchange can also contribute to a process that reduces demand for some tasks. The trace alone cannot establish the employment consequence.
The new worker survey does not validate every session label. It supplies a second unit: what linked respondents say about their own work and beliefs. Agreement between activity and reported capability may show that measures are related, but neither captures the whole job. A mismatch may reveal different task mixes, missing work, or perceived capability beyond practical use. Those explanations should be investigated rather than silently resolved in favor of one measure.
Logs remain useful after self-reports arrive. The two forms of evidence complement each other: logs describe a narrow but observable slice of product behavior; surveys describe workers’ interpretations and expectations, with limits of memory, wording, and selection. Together they can generate a better research question. They cannot substitute for local task evidence, audited quality, employer decisions, or employment records.
There is also an important absence in a platform trace: it does not routinely show rejected outputs, offline checks, or consequences. If a draft was discarded after review, a log may show the attempt but not the time and reason for rejection. If a user accepts a flawed answer, the conversation may not reveal later correction. This does not make logs intrinsically unreliable; it means that “activity occurred” and “work was successfully completed” are different claims. The survey adds perceived experience but does not objectively audit final quality either.
Sources: Anthropic Economic Index report: Cadences; Which Economic Tasks are Performed with AI? Evidence from Millions of Claude Conversations
How is reported exposure different from observed use?
Anthropic’s measures sound similar but answer different questions. Observed exposure refers to occupational tasks appearing in Claude use. Reported exposure asks respondents what share of their own work tasks AI could do entirely on its own today. Anticipated exposure asks what share they expect AI could handle in 12 months. Theoretical exposure is a modelled estimate of tasks a language model could potentially perform. The first is product activity; the next two are survey answers; the last is a capability-oriented model. None counts tasks already removed from jobs.
Respondents chose among five ranges from almost none to nearly all; Anthropic plotted each selected range’s midpoint. The result supports group comparisons, but is not an exact task audit by each respondent. The report says close to six in ten chose a higher band for next year than today, and more than one third expected AI to handle most or nearly all tasks. These are expectations among linked Claude users, not a validated forecast or a population-wide estimate.
Anthropic reports that occupation-level reported exposure is positively correlated with observed and theoretical exposure. Yet reported exposure systematically exceeds observed exposure. The gap does not prove that logs undercount capability or that workers overestimate it. Respondents may perform a different mix of tasks from occupational averages; the sample includes frequent Claude users; and theoretical measures describe potential rather than ordinary performance. Several explanations may coexist.
The ILO’s 2025 update offers a contrast. Its research brief describes task-level assessment at six-digit occupational level covering nearly 30,000 tasks, combining human and AI input and assigning occupations to four gradients of potential exposure. It reports a mean automation score of 0.29 in 2025 versus 0.30 in 2023, while score variation narrowed from 0.30 to 0.14. It estimates one in four workers worldwide are in occupations with some exposure and says most jobs are more likely to be transformed than made redundant because human input remains necessary. This is occupational modelling, not worker reports or actual adoption.
The measures can disagree without either being mistaken. The ILO maps occupational task potential; Anthropic’s session data identifies tasks appearing in Claude use; the survey asks respondents what AI can do in their own work. A profession-level estimate smooths variation among people. A user response may reflect familiar tasks, recent demonstrations, or expectations. Keep unit and time horizon visible whenever comparing figures.
Translate exposure back into tasks. Is the work repeatable and digital? Does it need current, private, or specialized information? Who checks edge cases? What happens when an output is wrong? Is the task a draft, recommendation, decision, or accountable communication? A spreadsheet summary may be draftable yet require a person to reconcile definitions, detect a missing source, and explain a decision. Those conditions determine practical applicability better than an occupation label alone.
Treat exposure as a prompt for task inspection, not a verdict about a role. High technical applicability can make experimentation worthwhile, but adoption depends on access, governance, integration, cost, trust, and work redesign. Even widespread adoption does not mechanically determine labor demand: organizations may expand output, reassign tasks, or reduce some work. Displacement is a distinct outcome requiring employment evidence, not an exposure score.
A worker can use this distinction to avoid an unhelpful argument over whether an occupation is “exposed.” Instead, list five to ten recurring outputs and ask about each: Can a tool produce a plausible first version? Can it access the right material? Can it handle exceptions? What review does the output need? Who is accountable? A report that says exposure is high may be a reason to run this audit. It is not the answer to any one of these questions. The same occupation can contain tasks with very different answers.
Sources: Anthropic Economic Index report: Cadences; Generative AI and jobs: A 2025 update
What does the new evidence say about workers' experience?
The survey adds respondents’ descriptions of capability and tasks they think AI will not do. In the June report, people often pointed to judgment, contextual awareness, situational reasoning, trust-building, and managing people. These answers help identify what workers see as important. They do not establish that each task is permanently beyond AI or measure how well a system performs under a controlled test. This is a reported boundary, not a demonstrated technical limit.
The report finds a relationship between experience and perceived exposure. Respondents with at least 15 years’ experience estimated that AI could do roughly 10 percentage points less of their work than respondents in their first year. Anthropic suggests accumulated tacit or context-specific expertise may help explain the pattern. The cross-sectional self-report cannot show that experience caused the difference. Senior and junior workers may have different tasks, tool access, or standards for independent performance.
Consider an analyst asked to prepare a monthly performance note. Data extraction, a first-pass chart description, and a draft summary may be repeatable and digital. Deciding whether a metric changed because of a real operational shift, identifying a broken data feed, and explaining an exception to a leader may require domain context and accountability. A tool might help draft while the analyst remains responsible for checking definitions and presenting a defensible interpretation. This is an illustrative decomposition, not a case observed in the survey.
If experience includes knowing which exception matters, who can resolve a discrepancy, or how a customer will interpret a change, that knowledge may be valuable when a routine first draft becomes faster. Yet experience is not automatic protection. Judgment-intensive work may also be assisted and organizations can redesign who performs it. Ask whether contextual knowledge is used, preserved, and rewarded in the changing workflow rather than assuming “human skills” form a permanent safe zone.
Broad answers such as judgment should be translated into observable work: what evidence must be considered, which exceptions caught, who bears responsibility, and what explanation is expected? Open responses do not define these constructs precisely and are not a census of unique capabilities. The new evidence is useful in showing how respondents describe their own limits, but its meaning depends on operational detail.
For an individual, the durable part of experience may be the ability to frame a problem, assess whether an answer fits, verify it, and communicate consequences. These capacities are not proven immune to automation. They are practical assets to test in the work at hand. If routine production changes, document contributions in review, exception handling, client context, or coordination, then look for evidence that the redesigned role values them.
Experience comparisons can also be affected by what respondents mean by “the work.” A new employee may count basic drafting and research as central tasks; a long-tenured colleague may include escalation, tacit coordination, mentoring, and exception management. That difference does not imply one group is mistaken. It means task inventories and standards can vary within an occupation. A useful follow-up study would define tasks consistently and observe performance, but the June report’s self-report result is still valuable as a hypothesis about how familiarity and experience shape perceived capability.
What does it say about job change and job loss?
The survey reports that respondents more often expect major responsibility changes than loss of their own job. In the linked sample, more than a third said significant changes to their responsibilities were likely or very likely over the next year; 10% said losing their own job was likely or very likely. Among those who considered their loss likely or very likely, 38% attributed that expectation to AI in an open response. These are answers about expected events, not a count of changes or separations that later occurred.
Anticipated redesign and anticipated loss are different. Work may change because tasks move between people and software, output expectations rise, or responsibilities shift toward review and coordination. Such changes may improve some jobs, intensify others, or reduce demand for particular tasks. A survey about responsibility change is not an employment forecast; perceived job loss is not an actual displacement rate.
Anthropic notes respondents skew toward knowledge workers in relatively stable employment, so their baseline risk may differ from the U.S. workforce. The report also says respondents were more worried for others, especially junior colleagues, than for themselves. Those answers reveal a perception pattern. A respondent’s estimate about a colleague is not an observed probability for that colleague and should not be presented as a measured labor-market hazard.
The U.S. Bureau of Labor Statistics explains that employment projections are conditional outcomes under stated assumptions, rather than predictions of what must happen. Its discussion of AI notes uncertainty about long-term effects and the time it can take for employers and workers to integrate technology. This does not refute respondent concerns; it shows why expected change and measured employment outcomes use different evidence and time horizons.
Local signals are more actionable than sample-wide sentiment. They include documented changes in assignments, a workflow rule, shifted review responsibility, staffing or hiring criteria, or a plan to use a system in a process. Each still needs interpretation: a pilot is not full adoption; a license is not routine use; task automation is not necessarily a headcount reduction. Ask what changed, who does the work now, and what would show the change is durable.
If local evidence is limited, prepare without assuming the worst: map recurring tasks, learn applicable tool rules, and build verification skill. If a manager confirms redesign, compare responsibilities against interests, salary needs, location, training time, health, and family obligations. A career move may be reasonable, but the survey does not establish urgency or tell you which alternative is feasible.
The 10% answer should not be read as an estimate that one in ten of all workers will lose a job to AI. It refers to the share of this survey’s respondents who selected likely or very likely for their own job loss over a one-year horizon. The 38% attribution is conditional on respondents in that subset and comes from an open-ended explanation. The denominator changes between those statements. That conditional structure is easy to lose when a figure is pulled out of context, so state both the group and the question whenever citing it.
Sources: Anthropic Economic Index report: Cadences; Artificial Intelligence (AI) impacts on employment projections
Why do more automated users report optimism?
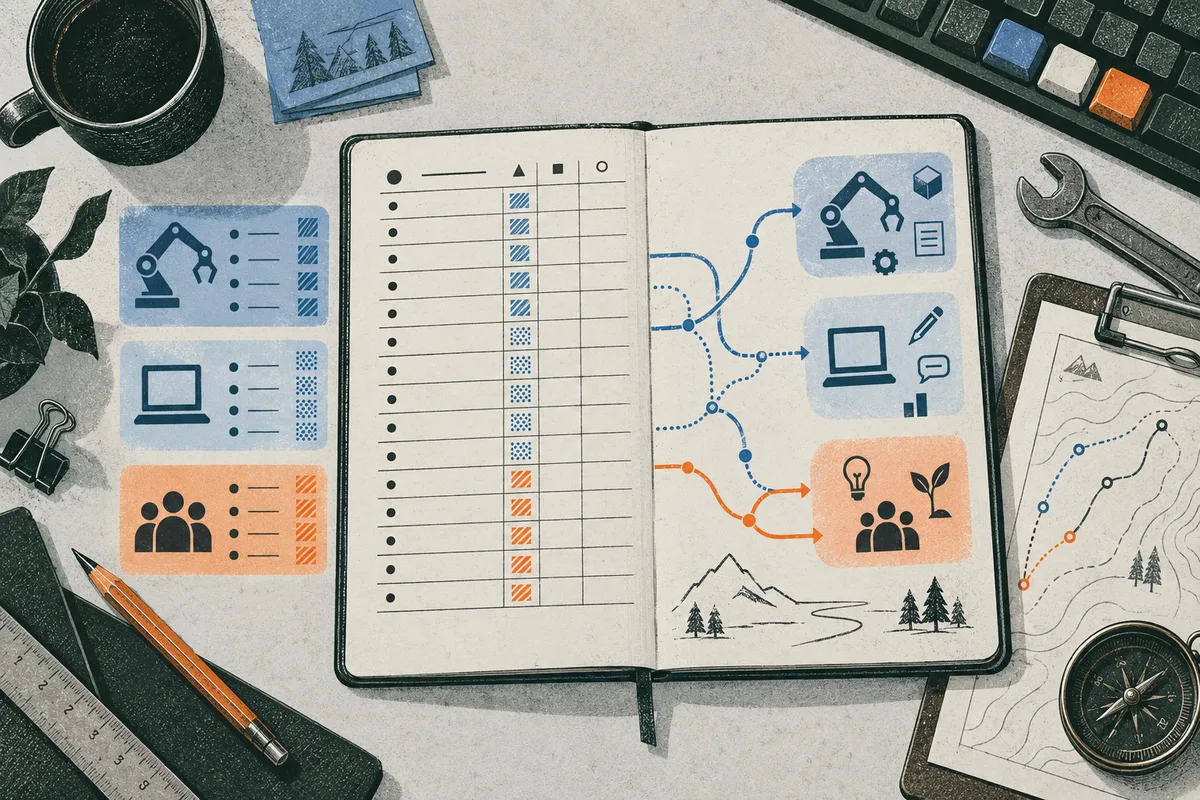
Anthropic finds that respondents with a higher share of automated Claude sessions were more optimistic about expected effects on six job-quality dimensions: pay, security, ability to find another job, meaning, autonomy, and human interaction. The report describes regression associations between automation share and positive expectations. It also finds heavy delegators reported learning at similar rates to other respondents, while cautioning that this does not rule out skill erosion. These are linked activity patterns and self-reported expectations, not verified wages or skills.
Two interpretations are plausible. People who already feel positive about the technology may be more willing to hand off whole tasks. Alternatively, people who delegate may experience useful gains that make them more optimistic. Anthropic says it cannot rule out selection, even though the relationship remains after controlling for tenure on Claude.ai, used as a rough proxy for early-versus-later adoption. One control does not remove every unmeasured difference between people and workplaces.
The linked comparison is cross-sectional: it connects a short activity window with survey answers rather than assigning workers to delegation levels and tracking outcomes over time. It cannot establish whether use changed beliefs, beliefs changed use, or both reflect another factor. A worker with employer approval and a well-scoped task may have a different experience from one doing high-stakes work with unclear quality standards. The survey does not isolate those workflow conditions as causal effects.
Optimism is not proof that delegation improves work. A task may take less time while responsibility for errors remains. A draft may be more polished but require additional fact-checking. Someone may report learning while losing practice in a routine step, or shift toward judgment work and learn more. Distinguishing these possibilities requires longitudinal measures of quality, workload, skills, task assignment, and outcomes, not just a one-time attitude response.
A positive current-user experience can coexist with uncertainty about who benefits. If output rises, an organization might expand service, reduce backlogs, or ask the same team to do more; it might also reduce demand for some tasks or concentrate gains elsewhere. The survey does not settle distribution. It shows how sampled users expect AI to affect their work, not that employers will share productivity gains through pay, security, or autonomy.
Test delegation by whether final work meets the real standard, review time is counted, errors are caught, and you can explain the result. Record what the system did, what you checked, and what you changed. That turns optimism into a workflow judgment. If delegation removes a useful learning step, preserve practice through review, deliberate reconstruction, or another task that builds the same foundation.
A positive expectation can have real value as a description of experience, even without predicting an outcome. It may show that delegation is not felt uniformly as a threat among users who have tried it. That can inform the design of follow-up questions: what tasks were delegated, what remained under human control, what gains were noticed, and who bore the verification burden? These questions preserve the signal without turning a correlation into a recommendation that workers should maximize automation share.
Who is missing from the new evidence?
Anthropic explicitly says its survey is not representative of the general population. It randomly invites Claude users, but completion is voluntary and June analysis filters out people with fewer than five sampled sessions. Those choices define who enters the linked sample. A random sample from a product’s user base is not a random sample of workers, and a linked analysis of frequent users is narrower still. Read it as evidence about participating Claude users who met the threshold.
The occupational comparison makes the limitation concrete. Computer and mathematical occupations account for roughly 30% of respondents, compared with 4% of U.S. employment; management is 23%, compared with 7%. Several physical-work groups, including transportation and material moving, food preparation and serving, and construction and extraction, are underrepresented. This limits claims about how common these experiences are across the U.S. workforce, particularly for work less likely to occur in a digital assistant’s logs.
The issue also applies outside the United States. Anthropic compares occupational shares with U.S. employment categories, but its users live across labor markets, languages, infrastructure conditions, and workplace norms. Relationships with country income and experience do not make the sample representative for each country. A pattern among users of one service cannot be assumed to describe workers with different access, languages, employer policies, or task structures.
Selection can operate through access to the product, choosing to use it, being invited, choosing to answer, and meeting the usage threshold. The report documents invitation, response selection, filtering, and occupational skew. Other possible issues, such as employer permission or confidence about discussing work, are reasonable questions but should not be presented as measured defects unless the study tests them. Naming uncertainty carefully is more informative than declaring every imaginable bias established.
The selection story is not only a weakness. Linking answers to recent use lets researchers examine whether perceptions vary with observed behavior in a way a broad poll cannot. The cost is narrower inference. A national panel may better estimate how many workers report use but have less detail about interactions with a specific product. Anthropic offers detail about its users but cannot estimate workforce prevalence without a population-appropriate design.
When reading a result, keep its population in the sentence. “Among linked Anthropic respondents” is supported. “Among U.S. knowledge workers” is broader and may not be. “Workers everywhere” is broader again. If a decision affects a particular occupation, country, or group, seek evidence designed for that population or collect local information. A limited sample need not be discarded; its scope must travel with the conclusion.
The report’s occupational skew also affects apparently ordinary summaries such as “most respondents expect” or “workers said.” The accurate population phrase is the linked respondent sample, which is disproportionately drawn from occupations that interact digitally with Claude. People doing physical tasks may use digital systems in planning or recordkeeping, but the observed assistant conversations will not necessarily represent their core work. This is a coverage limitation as well as a sampling limitation: some activities may not be legible in a chat-based trace even when workers use technology elsewhere.
Sources: Anthropic Economic Index report: Cadences; Generative AI and jobs: A 2025 update; Workers’ views of AI use in the workplace; The Rapid Adoption of Generative AI; Artificial Intelligence (AI) impacts on employment projections
How should readers compare this with worker surveys and exposure indexes?
Different sources describe different layers without contradicting one another. Anthropic’s session records describe classified Claude use; its survey describes participating users’ views; the ILO estimates potential task exposure; worker surveys estimate reported use or attitudes across broader populations; employer surveys describe adoption; employment records and projections address outcomes or conditional futures. Compare who or what was measured, when, and with which instrument.
Pew Research Center’s February 2025 report, Workers’ views of AI use in the workplace, surveyed U.S. workers about future AI use and long-run job opportunities. It reports 52% felt worried about workplace AI use and 36% hopeful. This measures broad attitudes and includes workers who may not use Claude. It does not link each answer to that person’s use of a specific assistant. Its percentages cannot be set beside Anthropic’s task-capability bands as if both measured the same construct.
The Management Science article The Rapid Adoption of Generative AI uses a series of nationally representative U.S. surveys to study adoption and reported work use. The authors estimate adoption and self-reported time savings, while emphasizing that effects depend on adoption speed, intensity, industry, and firm climate. This informs broader reported use, but time savings are not verified productivity and do not demonstrate job cuts. Its population and questions differ from Anthropic’s, so the datasets should complement rather than be numerically merged.
The ILO update assesses almost 30,000 occupational tasks and assigns four gradients of potential exposure. Its 2025 brief reports a lower average automation score than in 2023 and narrower score spread. It concludes most jobs are more likely to be transformed than made redundant because human input remains necessary. This interpretation of a task framework is not proof that no occupation will face displacement; it does not measure a particular employer’s adoption or a particular worker’s duties.
BLS projections answer a separate question. The agency says they are conditional on assumptions, not predictions, and AI’s long-term employment effects are uncertain. Such projections provide a structured view under stated conditions but cannot reveal an individual outcome. A user survey may capture expectations before aggregate data reflect change; being earlier does not make an expectation more accurate. Outcome data may also fail to identify the cause of change.
A fair comparison is dimensional. Anthropic links subjective accounts to recent activity on one platform, but its sample limits population inference. Pew offers broader worker attitudes but no linked product traces. ILO maps potential occupational tasks but not actual practice. The Management Science study targets adoption and reported time use, not displacement. BLS covers conditional labor projections, not current worker perceptions.
Apparent disagreement may come from different measures. Workers can worry while having little direct use; high exposure can coexist with modest adoption; adoption can coexist with task augmentation and rising demand; productivity reports can coexist with extra verification. These are separate stages between technical possibility and employment outcomes, not contradictions. The mistake is treating one measure as a shortcut through the whole chain.
When a claim sounds alarming or reassuring, name its evidence type: capability, observed use, self-report, adoption, redesign, demand, or displacement. Then check population, time window, and method. If the conclusion goes beyond the source’s measure, label the inference and test alternatives. This quick reading habit protects against numbers that sound universal despite coming from a narrow group or single question.
For a career decision, combine evidence only after separating it. Exposure identifies where to experiment; local adoption evidence shows whether an experiment is entering a workflow; quality and workload records test whether it works; demand data can inform employment prospects; worker surveys add experience. Each has limits. Together they offer more useful questions than one score.
External comparisons work best when they answer a different part of the question, not when used to declare a winner. Pew’s probability-based worker sample can broaden the view of attitudes; the Anthropic link can give detail about users’ beliefs alongside activity. The ILO provides a structured task framework; BLS gives conditional employment projections. A practical evidence file can note each source’s population, date, unit, method, and limitation in one sentence. That discipline makes disagreements interpretable and helps reveal where evidence is still missing.
Sources: Anthropic Economic Index report: Cadences; Announcing the Anthropic Economic Index Survey; Generative AI and jobs: A 2025 update; Workers’ views of AI use in the workplace; The Rapid Adoption of Generative AI; Artificial Intelligence (AI) impacts on employment projections
What should a worker do with the added evidence?
Use the June survey as a prompt for a task audit, not a trigger for a costly career decision. Write down recurring outputs, who uses them, and what makes them acceptable. Separate preparation, drafting, checking, judgment, communication, and accountability. Identify which steps are digital and repeatable, which need current or private information, and where an error would matter. This gives you a unit to compare with reported exposure and observed use.
If workplace policy permits, test one bounded task with a clear quality standard and manageable consequences. Record baseline time, setup time, verification time, and corrections. Ask whether the result is accurate, complete, appropriate for its audience, and reproducible. If your employer has not approved the tool or data use, do not enter confidential work; ask which systems and information are allowed. This is a workflow check, not an estimate of personal job-loss odds.
Keep four evidence columns in your notes: what you observe in approved tools or team workflows; what you or colleagues believe AI can do, marked as opinion or test; expected changes and their time horizon; and local organizational evidence such as changed assignments, review rules, training, hiring criteria, or staffing plans. Label source and date. This prevents an external expectation from being mistaken for an employer decision.
Choose a proportionate next step. If a tool helps with a bounded routine component and quality checks are manageable, improve task specification, verification, and explanation. If work shifts toward review or exceptions, ask whether those responsibilities count in workload and evaluation. If demand appears to change, investigate adjacent work using your domain knowledge and compare prerequisites, salary, geography, and training burden. A larger move deserves local evidence and attention to your constraints.
A worker with limited time or money need not begin with an expensive credential. A small project using non-sensitive information can test a real task and demonstrate verification. A short course may help with a specific foundation; a certificate may provide structure or a signal only where employers value it. A degree or substantial technical training makes sense when target work requires that depth and the person can bear the time and cost. This survey does not tell every reader to retrain.
The verdict is that Anthropic’s worker-reported addition improves interpretation by connecting what selected users say with a slice of recent Claude activity. It adds perceived capability, expectation, and concern that product logs alone could not supply. The important exception is that the user base, voluntary response, frequency filter, short window, and self-report constrain claims about workers generally and future employment. Use it to form a task-level question, then check local evidence.
If you need help translating an occupation into specific task signals, the free [task-level change-pressure checker](/ai-job-risk-checker) can be a starting point. It provides transparent change-pressure signals, not a validated probability of displacement, and should not replace evidence about your workflow. If comparing a stay-and-redesign option with adjacent or larger changes, the optional [career roadmap](/career-roadmap) compares scenarios against experience, salary floor, geography, learning time, and constraints. The report is understandable without either product.
The next step may be one focused conversation. Ask your manager or a trusted colleague: “Which parts of this workflow do you expect to change in the next six months, what quality standard will we use to check AI-assisted work, and who remains accountable when the output is wrong?” A concrete answer gives local evidence. If no answer exists yet, agree on a small, reversible test and a date to review it. That is more defensible than treating a survey statistic as a personal forecast.
A small task audit should include friction as well as capability. Record setup, permissions, data cleanup, review, correction, and handoff time, not only how quickly a draft appears. Include errors found and whether they were easy to detect. Ask whether the task is high-volume enough for the workflow to matter and whether the tool is allowed in the actual environment. These observations help distinguish a demonstration from a workable process. They also give a manager a concrete basis for discussing training, safeguards, and responsibility instead of debating an abstract claim about AI taking jobs.
A good conversation should separate three things that often get bundled together: what the tool can do in a controlled demonstration, what the team is currently using it for, and what the organization expects to change. Ask for the specific workflow and the evidence behind the proposed change. If a manager mentions faster drafting, ask how accuracy and review time will be evaluated. If the change affects staffing or role scope, ask when decisions will be made and what criteria will apply. If the answer is not known, record that uncertainty rather than filling it with an outside forecast. Workers with limited bargaining power can still seek written guidance, document their contributions, and identify a reversible learning step. The purpose is to get clarity about decisions within the organization’s control, not to demand certainty about the entire labor market. A useful follow-up date also matters: a pilot can look promising in a week and create new checking work over a month. A review point makes it possible to notice both benefits and costs before informal expectations harden into permanent responsibilities. If the manager cannot answer immediately, ask who owns the question and when the team can revisit it. That keeps the discussion grounded in observable work and creates a record against which future changes can be compared.
This is also where personal constraints belong. A worker supporting family, managing a health condition, or unable to relocate may reasonably prefer an upgrade or adjacent move over a full retraining path, even when another option looks attractive on paper. Compare the actual entry requirements, schedule, likely training cost, and salary floor before committing. Do not assume an AI course supplies access to supervised practice or employer demand. The survey has no information about your budget or obligations; those facts must shape the decision separately.
Finally, retain a baseline so that later impressions have something to compare against. Note which tasks take time now, where errors arise, and which decisions require your expertise. Revisit the notes after a pilot or workflow change. This will not prove what caused a business outcome, but it can make a personal learning decision more evidence-based and help you describe your contribution in specific terms.
The report’s contribution is therefore a better map of questions, not a shortcut to certainty. It gives workers and researchers an additional perspective to test alongside observed use and labor evidence. The proper conclusion remains bounded by who answered, what was linked, and what the study actually asked.
Keep that distinction visible when discussing findings with colleagues.
Sources: Anthropic Economic Index report: Cadences; Announcing the Anthropic Economic Index Survey; Generative AI and jobs: A 2025 update; Artificial Intelligence (AI) impacts on employment projections
Questions readers ask
Does Anthropic’s 2026 survey show how likely my job is to be replaced?
No. It reports perceptions and expectations from a selected sample of Claude users and links them to recent Claude activity. It does not estimate an individual probability of job loss or measure realized displacement. Use it to identify tasks to inspect, then look for local evidence such as changed assignments, workflow rules, staffing, or hiring requirements.
Why combine worker reports with AI usage data?
Usage data describes what people ask a particular system to do; worker reports describe what those users believe AI can do and what changes they expect. Linking the two lets researchers examine relationships between use and perception, but does not prove causality or make respondents representative of all workers.
Sources and notes
- Anthropic Economic Index report: Cadences
Supports the June 2026 linked survey, respondent count, measures, results, and sample limitations.
- Announcing the Anthropic Economic Index Survey
Supports the survey purpose, monthly invitation plan, Claude-user sampling frame, and questions.
- Which Economic Tasks are Performed with AI? Evidence from Millions of Claude Conversations
Supports the earlier single-platform usage approach and its explicit coverage limitation.
- Generative AI and jobs: A 2025 update
Supports the ILO task-exposure method, score changes, and interpretation of job transformation.
- Workers’ views of AI use in the workplace
Supports U.S. worker attitudes about workplace AI reported in Pew’s February 2025 study.
- The Rapid Adoption of Generative AI
Supports nationally representative U.S. survey evidence on AI adoption and reported work use.
- Artificial Intelligence (AI) impacts on employment projections
Supports BLS’s explanation that projections are conditional and AI employment effects uncertain.
Apply this to your own work
See the whole job market at once.
Explore which occupations AI may reshape, then turn the signal into a practical response.
Explore the job map